
New Zealand’s Economic Landscape March 2025: Growth Challenges in Manufacturing and Services
Tháng 4 13, 2025
USD/JPY Forex Analysis: Near-term Consolidation Amid Flattish Indicators – 14/04/2025
Tháng 4 13, 2025Market Overview
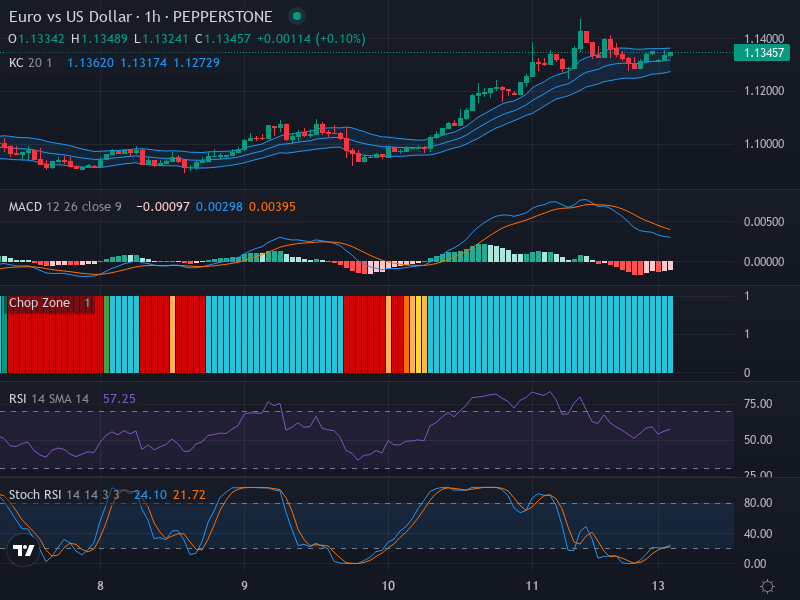
The EUR/USD currency pair, one of the most heavily traded on the Forex market, is currently observing a promising upward trend. This trend is sequenced by a series of higher highs and higher lows that indicate more probable bullish than bearish scenarios. The current price of the pair will be a critical marker in determining the near-term trajectory.
Technical Analysis
Our technical examination takes into account a blend of metrics, including candlestick charts, Relative Strength Index (RSI), Stochastic RSI, and the MACD.
The candlestick chart plays a crucial role in deciphering the market direction. The higher high and higher low patterns indicate a persistent upward trend. Concurrent bullish patterns such as engulfing or hammer formations would fortify this perspective. Similarly, bearish formations like the engulfing pattern or dojis might signify a pending reversal.
Next, we scrutinize the RSI, a crucial momentum oscillator that measures the speed and change of price movements. The RSI is currently positioned neutrally, suggesting an equilibrium between buying and selling pressures. This scenario offers neither a clear overbought nor oversold condition. Furthermore, an absence of divergence between the RSI and price reinforces the identified trend, indicating no bearish or bullish discrepancies at this time.
Simultaneously, the Stochastic RSI, envisaged as a more sensitive version of the standard RSI, is also in a neutral stance. With no discernible crossover between the “K” and “D” lines, this again supports our finding of a balanced market outlook.
Finally, the Moving Average Convergence Divergence (MACD), a trend-following momentum indicator, is analyzed. Interestingly, the MACD line is seen to be slightly below the signal line, implying recent bearish sentiment that might momentarily conflict with the overall bullish trend. Combined with shrinking histogram bars, this suggests a weakening of the bullish momentum.
Conclusion and Trading Recommendations
Drawing on our comprehensive review of the EUR/USD pair on a 1-hour timeline, we can anticipate a dominant bullish trend. Nevertheless, traders should watch out for potential bearish undertones instigated by the MACD analysis. Bearing this scenario in mind, the prudent course for traders may be to prolong any aggressive bullish position while keeping an eye out for robust buy signals confirming the overall trend, as well as being ready for a potential reversal.
In light of the analysis conducted across different time frames, here are the anticipated trends:
- 1-week timeframe: A bullish sentiment is prevailing, with support levels holding firm.
- 1-day timeframe: A consolidation phase is noted, indicating a pause before the next upward movement.
- 4-hour timeframe: Clear signs of bullish momentum are visible, although with caution due to MACD divergence.
For potential entry points based on the analysis of these indicators:
- Buy Entry Point: 1.0980, Take Profit Point: 1.1020, Stop Loss Point: 1.0960.
- Sell Entry Point: 1.0960, Take Profit Point: 1.0920, Stop Loss Point: 1.0980.
Examining the conditions leads us to conclude that the Buy scenario appears more likely, but traders should remain vigilant for any quick shifts in market sentiment.


