
G7 Meeting 2025: Insights on the Global Economy and Economic Policies
Tháng 5 20, 2025HCOB Composite PMI Analysis for Germany: May 2025 Trends Revealed
Tháng 5 20, 2025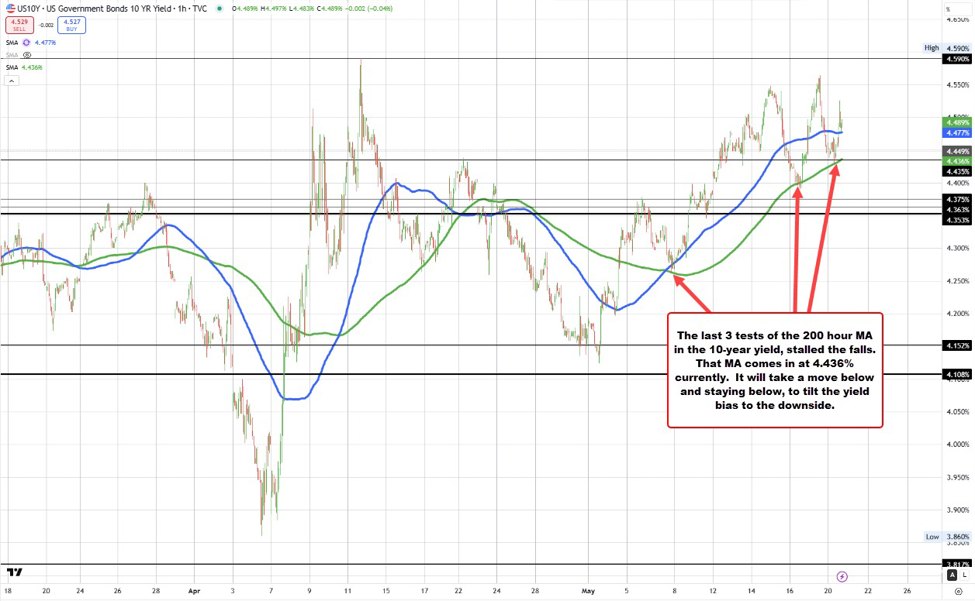
Recent Technical Developments of the US 10-Year Treasury Yield: A Bullish Outlook
The US 10-year Treasury yield has garnered significant attention recently due to its noteworthy technical developments, particularly its ability to maintain a position above the critical 200-hour moving average. This situation strongly implies a bullish outlook in the realm of technical analysis, inviting traders and investors to reassess their strategies in light of recent movements.
Bullish Technical Patterns Emerging
The first significant observation is the breakout of the 10-year Treasury yield above a down-sloping trendline, effectively completing a bull flag formation. This pattern consists of two key components. The flagpole, which represents a rapid rally, surged from approximately 3.75% to an impressive 4.35%. Following this sharp ascent, a flag formed as the yield consolidated sideways around the 4.20%–4.30% range. The breakout above 4.35% signifies renewed upward momentum, catapulting the yield to around 4.52%, indicating strong market confidence.
For traders looking to avoid common investment pitfalls, it’s important to recognize the significance of disciplined decision-making in this phase of upward movement. Exploring investment strategies can be fortified by understanding key investment mistakes to avoid for long-term financial success.
In addition to the bull flag formation, another notable technical pattern has emerged: an inverse head and shoulders. This bullish configuration is characterized by three distinct parts. The left shoulder was identified near the 4.10% level, a head was marked at 3.95%, and a return to the right shoulder again reached 4.10%. This pattern is a classic indicator of potential bullish continuation, signaling that further upside may be forthcoming based on the prevailing market trends.
The measured upside based on this inverse head and shoulders pattern suggests a target range between 4.74% and 4.75%. This target aligns with historical pivot highs observed in October 2023 and January 2025, making this area a critical resistance level that traders should monitor closely.
Technical Support from the 200-Hour Moving Average
Holding above the 200-hour moving average is a significant development in terms of technical analysis. This moving average serves as a crucial support level for short- to medium-term trends. The yield’s ability to sustain its position above this average reinforces the strength of the recent breakout, indicating robust bullish momentum in the market.
Such technical behavior raises the likelihood that the yields could continue their ascent towards the projected 4.75% target zone, provided there are no systemic shocks or negative data releases that might alter investor sentiment. To that end, traders should also be keenly aware of psychological pitfalls and conflicts of interest, which can influence their investment decisions during such pivotal market moments.
Current Market Context and Yield Fluctuations
As of mid-May 2025, the 10-year Treasury yield has been oscillating in the range of 4.49% to 4.54%, reflecting both volatility and adherence to the established upward trend. Market experts have noted a trend of rising Treasury yields, with expectations of continued volatility and broader trading bands, creating an enticing backdrop for traders.
Despite emerging risks such as inflationary pressures and tariff-induced economic concerns, the overall environment surrounding fixed-income securities remains appealing. This situation suggests that duration may again assert itself as a hedge against potential growth downturns, further solidifying investor interest in these securities.
Conclusion
In summary, the recent technical patterns surrounding the US 10-year Treasury yield, including the breakout above the key 200-hour moving average, the completion of the bull flag formation, and the emergence of an inverse head and shoulders, all signal a strongly bullish outlook. These developments suggest substantial upside potential toward the 4.74%–4.75% range, a critical resistance level. As traders and investors navigate this landscape, these technical indicators, buoyed by broader market sentiments, pave the way for strategic decision-making in the fixed-income arena.