
The Australian Dollar’s Future: How Trump’s Tariff Pause Influences Global Trade
Tháng 4 10, 2025Goldman Sachs Predicts China’s GDP Growth Amid Trade Turbulence: Key Insights and Implications
Tháng 4 10, 2025Market Overview:
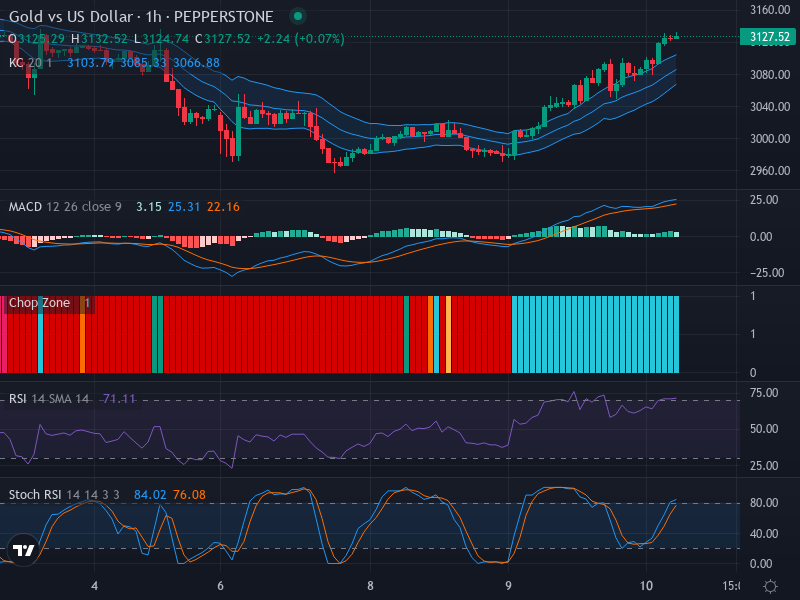
The Gold Vs US Dollar pair is currently attracting attention with its strong upward trend. The momentum has been primarily bullish, with several successive bullish candles bolstering the uptrend. The current price sits at 3127.52 and may potentially test the resistance level at 3150 as suggested by the behavior of price action within the upper Keltner Channel band.
Technical Analysis:
An examination of the candlestick patterns reveals a dominant bullish momentum in the market. The price action points towards a potential surge, targeting the upper boundary of the Keltner Channels, possibly creating a mild resistance at 3150.
Moreover, the Relative Strength Index (RSI) mirrors this trend with an overbought value of 71.11. This situation typically precedes a period of price retracement or consolidation, hinting at a possible impending correction. Interestingly, the presence of RSI divergence could also signify an adverse scenario in which the bullish strength shows signs of fatigue, indicating a possible shift in momentum.
According to the stochastic RSI, with K Line at 84.02 and D Line at 76.08, the pair is in the overbought territory, reinforcing the possibility of an imminent downtrend or at least a consolidation phase. Subtle signs of a potential bearish crossover add weight to this speculation.
The Moving Average Convergence Divergence (MACD) analysis aligns with the bullish sentiment prevalently displayed in recent periods. With a MACD line at 3.15 and a signal line at 2.31, the histogram indicates an increasing bullish momentum. The absence of significant divergence corroborates the prevailing uptrend.
Analysing the Keltner Channels and Chop Zone indicators, the price seems to hover near the upper band, potentially signifying an overextension. Furthermore, although the chop zone’s predominant blue color indicates a trending market, it also indicates potential volatility, which should be of interest to traders.
Conclusion and Trading Recommendations:
Considering the comprehensive technical analysis, the 1-Week trend suggests a bullish market for Gold Vs US Dollar with well-founded expectations of hitting the resistance level at 3150. Traders should keep an eye on possible development on the anticipated bullish surge. However, the strong overbought conditions as suggested by RSI and stochastic RSI call for caution and imply a potential retracement or consolidation phase. Therefore, profit booking at higher levels might be a wise strategy, especially if the retracement materializes.
The analysis of different time frames reveals the following:
- For the 1-Week timeframe, the trend is predominantly bullish, with the potential to test 3150.
- The 1-Day timeframe indicates a tense market condition, with strong overbought signals suggesting consolidation or retracement ahead.
- The 4-Hour timeframe shows signs of price fatigue, with multiple indicators hinting at a weakening bullish momentum.
Given these insights, potential entry points include a Buy entry point at 3128 aiming for a Take profit point at 3150 and a Stop loss point at 3115. Conversely, a Sell entry point can be set at 3152, targeting a Take profit point around 3135 with a Stop loss point at 3165. The analysis favors a Sell scenario likely due to current overbought conditions and expected market correction.


