
A Potential Reversal on the Horizon for USD/CAD – 26/05/2025
Tháng 5 25, 2025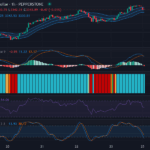
Gold vs US Dollar: Analysis Indicating Bearish Momentum Amid Sideways Market Conditions – 26/05/2025
Tháng 5 25, 2025Market Overview:
The USD/JPY currency pair has recently drawn keen attention as multiple technical indicators start to align towards a potential upward direction. Historically, the predominant market direction for the pair has been downward. However, meticulous study of the recent candlestick activities and other key patterns suggests a potential shift toward bullish behavior.
Technical Analysis:
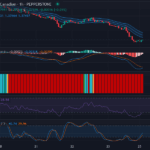
Inspecting the candlestick chart patterns, we see evidence of a budding bullish push. A potential support zone has been identified near 142.50 levels, suggesting a likely bounce in the currency pair prices from this level. Nonetheless, it is essential to monitor future price action keenly for confirmation of this potential trend reversal.
Focusing on the Relative Strength Index (RSI), a valuable tool for identifying overbought and oversold conditions, we observe an RSI value of 45.17. This indicates a neutral market condition leaning on the verge of the oversold zone, which hints at a possible upward price momentum ahead.
Moreover, the Stochastic RSI, an indicator highlighting the RSI’s overbought and oversold conditions, reveals a bullish crossover. It shows the K line (75.52) is above the D line (53.28), which typically foretells an increase in buying pressure.
The chart’s recent price action shows it inching closer to the middle band of the EMA 20 in the Keltner channels. It’s conventionally considered that a break above this band could signal further bullish actions. The moderate volatility, corroborated by the somewhat narrowing Keltner Channel, also backs this upward potential.
Simultaneously, the Chop Zone analysis corroborates this narrative, revealing predominantly red candlesticks, hinting at the less directionality of the price action, which usually signifies consolidation preceding a trend break.

Conclusion and Trading Recommendations:
In summary, while the long-term trend for USD/JPY has been bearish, the current technical analysis paints a different picture. Potential support around 142.50, bullish crossovers in the Stochastic RSI, and hints at an upward breakout through the EMA 20 line on the Keltner chart are collectively suggesting a potential bullish turn.
Traders and investors might want to consider a buying position if the forthcoming price action confirms these bullish signals. However, maintaining a tight stop loss to manage potential downside risk is advisable.
Time Frame Analysis:
- In the 1-week time frame, the overall trend remains bearish, but the emergence of bullish indicators suggests a possible slowing of downside momentum, paving the way for a potential reversal.
- Over the 1-day time frame, bullish signals are starting to appear, notably the potential support near 142.50, indicating a possible upward movement.
- The 4-hour time frame shows tightening volatility in prices, suggesting that a breakout could happen soon, leading to significant price movement.
Entry Points:
- Buy Entry Point: Buy at 143.00, Take Profit at 144.00, Stop Loss at 142.30.
- Sell Entry Point: Sell at 141.70, Take Profit at 140.70, Stop Loss at 142.00.
In conclusion, the analysis indicates a Buy scenario is more likely to occur given the bullish signals and potential bounce from the support level.


