GBP/USD Forex Analysis: Examining the Downward Trend and Possible Reversal – 08/05/2025
Tháng 5 7, 2025The U.S. Sovereign Wealth Fund: Paving the Way for Economic Resilience
Tháng 5 8, 2025Market Overview
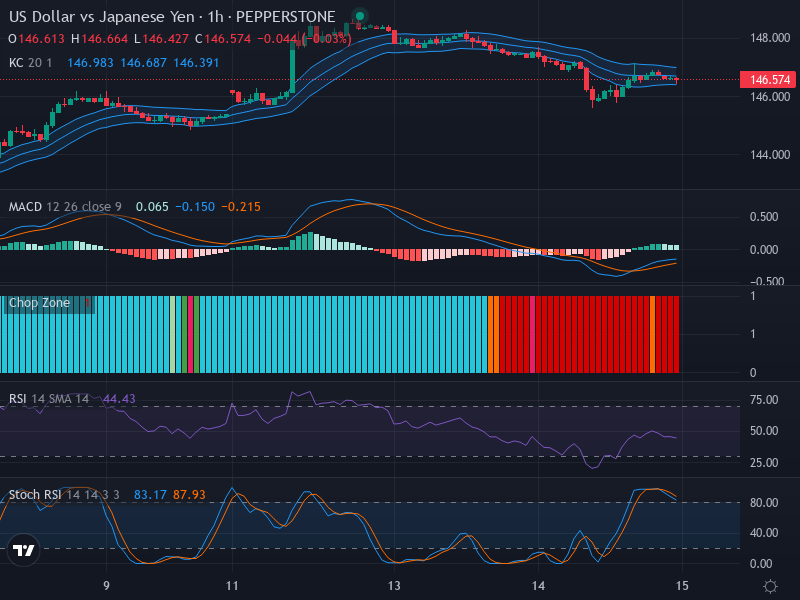
The United States Dollar (USD) vs Japanese Yen (JPY) Forex pair has been exhibiting a bullish trend recently. The trading indicators bolster the ongoing upward momentum, evidenced by consecutive candles closing higher than their opening points. As it stands, the pair is hovering around 143.837.
Technical Analysis
A careful examination of the ongoing bullish trend reveals a relative ease of movement indicated by bullish engulfing patterns, signifying potential increased robustness of the bullish trend. In terms of defined resistance and support zones, traders should watch out for an anticipated price surge resistance at around the 144.500 mark. Simultaneously, a retracement support zone looms near the 143.000 mark.
Breaking down the technical indicators, the Relative Strength Index (RSI), currently at 63.11, is leaning into the neutral to slightly overbought territory. The mild tilt towards being overbought supports the likely continuation of the upward price trend.
The Stochastic RSI further solidifies the bullish narrative. With the K Line at 90.73 and the D Line at 93.45, there’s an unmistakable signal of an overbought market condition. However, the lack of a significant crossover implies that the bullish pressure may remain unchecked, fostering a further uptrend.
Moving to the MACD analysis, the MACD Line Value, at 0.181, sits comfortably above the Signal Line Value of 0.119. This bullish crossover scenario emphasizes the rising bullish momentum, corroborated by the growing bars in the MACD histogram.
Lastly, Keltner Channels and the Chop Zone indicators suggest that the long-term trend of the price aligns closely with the bullish pattern dominant in the market currently.

Conclusion and Trading Recommendations
In conclusion, significant technical indicators and chart patterns signal continued bullish momentum for the USD/JPY forex pair. Traders should consider buying opportunities, keeping an observant eye on key resistance and support zones at 144.500 and 143.000, respectively. However, take note of the RSI and Stochastic RSI, which are teetering on overbought regions, signaling a potential market correction in the future.
Time Frame Analysis
Analyzing the trends:
- In the 1-week time frame, the USD/JPY exhibits a strong bullish trend, marked by consistent higher highs and higher lows.
- In the 1-day time frame, there is a surge in buying activity, signaled by the accumulation of bullish candlesticks.
- In the 4-hour time frame, a potential pullback could be imminent as the market nears overbought conditions, suggesting a cautious approach to entries.
Trading Entry Points
- Buy Entry Point: 143.850; Take Profit Point: 144.500; Stop Loss Point: 143.500.
- Sell Entry Point: 144.300; Take Profit Point: 143.500; Stop Loss Point: 144.600.
In summary, a Buy scenario appears more likely currently, given the existing bullish momentum, but traders should remain on alert for possible corrections as indicated by the overbought conditions in multiple indicators. It is advisable to maintain a prudent approach in positioning while monitoring market movements closely.