

Trump Considers Extending TikTok’s U.S. Operation: What’s Next for the Viral App?
Tháng 4 4, 2025
Warren Buffett Sets the Record Straight on Alleged Support for Trump’s Economic Policies
Tháng 4 4, 2025Market Overview
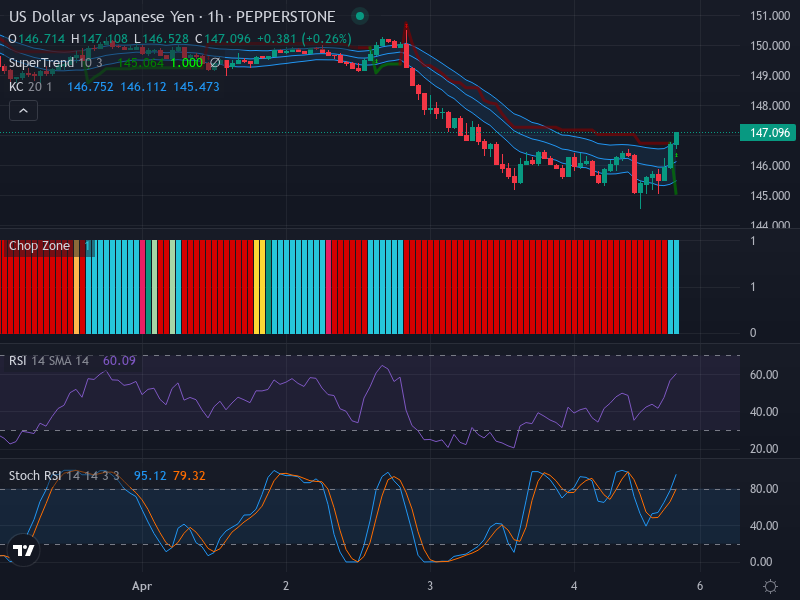
The USD/JPY pair continues to exhibit remarkable resilience in the face of mounting pressures, as evidenced by recent price increases. A general upswing in the market sees the Japanese Yen diminishing against the US Dollar, primarily underpinned by the potential bullish candlestick formation towards the end of the analyzed period.
Technical Analysis
Our in-depth examination begins with a bullish candlestick’s intriguing discovery, a strong hint of a turnaround from the erstwhile downward trend. The chart pattern’s bullish significance is given credence by recent price hikes, propelling the market in an upward direction.
Moreover, a targeted surge above the 147.5 price level appears in the offing, signifying an area where bullish momentum could further cement its foothold. Such a move may bolster the uptrend, securing a more pronounced reversal from the previous bearish trend.
Accompanying this bullish sentiment, the Relative Strength Index (RSI) hovers at the 60.09 mark, heralding a shift towards the overbought territory. However, it conveniently straddles the neutral line, aligning perfectly well with the current upward trajectory. At this stage, RSI does not signal any immediate reversal, supporting the idea of further bullish strides.
A similar story unfolds with the Stochastic RSI (Stoch RSI), wherein the K line at 95.12 dominates the D line at 79.32, corroborating rising bullish sentiment. Despite the pair being in an overbought zone—a status that typically encourages caution—the aligning sentiment with the market trend offers reason for optimism.
From a Keltner Channels perspective, the price has convincingly moved outside the established bounds, implying a prospective robust breakout. Simultaneously, the Chop Zone maintains a neutral stance, hinting at a shift from the previous sideways trend. The Keltner Channel’s outward expansion serves as a harbinger of proliferating volatility, introducing another layer of complexity to the strategy mix.
Conclusion and Trading Recommendations
Despite an overarching bearish tint over a one-week timeframe, the USD/JPY pair crawls towards a bullish recovery in the short term. The technical indicators are pointing towards an impending upward momentum, subject to certain caveats.
Traders should consider going long, taking into account the 147.5 level as a critical milestone that could either further validate the bullish swing or act as resistance. However, it is crucial to be mindful of potential retracements from the overbought territory. Should this occur, the strategy should align with shorter selling positions until the market renders a clearer direction again.
Trend Analysis
- In the 1-week timeframe, the overall market sentiment remains bearish, but signs of bullish recovery are beginning to emerge.
- The 1-day timeframe reflects a cautious but clear upward trend, indicating potential for further gains.
- The 4-hour timeframe is currently exhibiting strong bullish momentum, suggesting traders may find opportunities for short-term positions.
Potential Trading Points
For the USD/JPY, based on our analysis of the indicators:
- Buy entry point at 147.00, with a take profit target at 148.00 and a stop loss at 146.50.
- Sell entry point at 147.50, with a take profit target at 146.50 and a stop loss at 148.00.
In conclusion, considering the bullish momentum suggested by the indicators, a Buy scenario seems more likely to occur. However, traders should remain vigilant of any potential market corrections, especially given the current overbought signals.


