Unfolding Bearish Scenario: USD/CAD Under Bearish Pressure – 02/04/2025
Tháng 4 1, 2025
Sideward Oscillations Surface in GBP/USD’s Forex Charts: A Comprehensive Review – 02/04/2025
Tháng 4 1, 2025Market Overview:
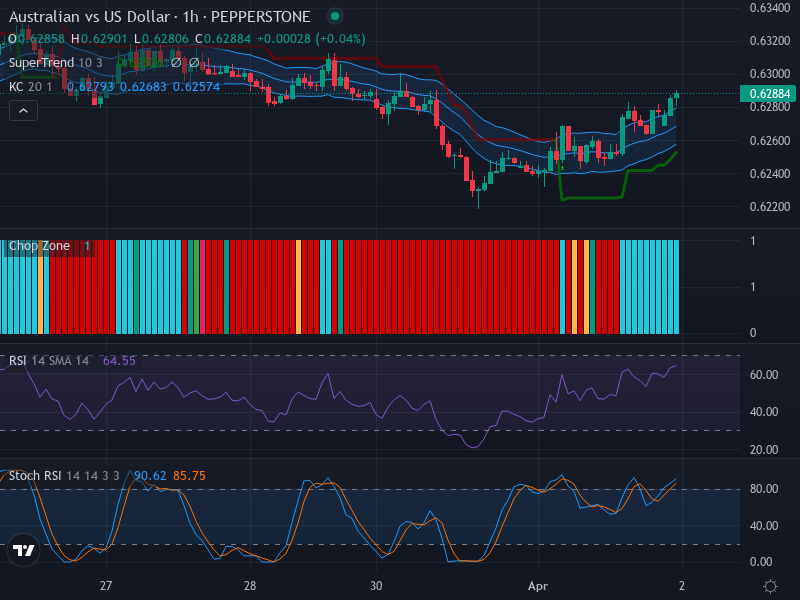
In the current scenario, the AUD/USD currency pair captures market attention as it presents a pattern that suggests an emerging bullish trend in its hourly chart. The Australian Dollar demonstrates a promising trajectory against the US Dollar, marked by a series of bullish candlestick formations juxtaposed with slight pullbacks.
Technical Analysis:
A detailed inspection of the chart reveals a distinctive pattern of bullish candlesticks, suggesting an upward trend on the horizon. While there have been slight pullbacks, the overall direction has remained resiliently bullish.
In terms of specific numbers, potentially crucial resistance appears to loom near the 0.6300 level. On the flip side, support emerges around the 0.6250 mark. Notably, a break beyond the recent highs could catapult the price considerably higher, indicating a robust upward thrust.
A look at the Relative Strength Index (RSI) substantiates the bullish narrative, albeit with a note of caution. With an RSI value of 64.55, the indicator leans towards the overbought territory, suggesting bullish momentum is in full swing but may be nearing exhaustion.
There is a congruence between the RSI and price trend, both ascending in unison without any noticeable divergence. This harmony reinforces the bullish sentiment but also hints at a potential pullback in the near future.
Further examination through the lens of the Stochastic RSI (Stoch RSI) paints a similar picture. With the K line at 90.62 and the D line at 85.75, both figures reside in the overbought territory. This positioning represents a potential exhaustion point of the current upward trend. A crossover between the K and D lines could signify a short-term reversal or a possible consolidation phase.
Shifting focus to the Keltner Channels and Chop Zone indicators, the price trend is inching towards the upper band of the Keltner Channels. This movement indicates a strong upward momentum. Although the Chop Zone previously highlighted a stagnant or trendless market, it is currently neutralizing as a bullish trend starts to take shape. Interestingly, the occurrence of two consecutive closes outside the Keltner Channel could signal a potential breakout and likely continuation of the upward trend.
Conclusion and Recommended Trading Strategy:
Drawing from the week’s trend, the AUD/USD chart exhibits a strong bullish tone. However, traders should proceed with caution as several indicators suggest it’s nearing overbought territory, hinting at possible pullbacks or consolidation.
Trend Analysis:
- 1-Week Chart: The trend shows significant bullish momentum, indicating overall strength in prices, but potential for consolidation due to overbought signals.
- 1-Day Chart: Moderate bullish trend persists; however, recent candlestick patterns suggest the possibility of temporary pullbacks.
- 4-Hour Chart: The trend remains bullish with increasing volatility, indicating that short-term reversals might offer strategic entry points.
Traders might find the following specific entry points relevant based on the analysis:
- Buy Entry Point: 0.6280, Take Profit Point: 0.6350, Stop Loss Point: 0.6250.
- Sell Entry Point: 0.6295, Take Profit Point: 0.6240, Stop Loss Point: 0.6305.
Based on the comprehensive analysis of indicators and recent market movements, a Buy scenario appears more likely if momentum continues. However, should there be signs of reversal indicated by RSI or Stoch RSI movements, considering the Sell scenario could also be beneficial. It’s essential for traders to maintain awareness of potential risks and adapt their strategies accordingly.
Risk Disclaimer:
It’s crucial to remember that forex trading involves significant risk, and past performance is not indicative of future results. Therefore, this analysis should only serve as one tool in an investor’s trading strategy. Always do your own research and consider potential losses before making trading decisions.