
A Comprehensive Technical Analysis: Gold vs US Dollar (1h) – PEPPERSTONE – 10/04/2025
Tháng 4 9, 2025Navigating Japan’s Economic Crossroads: Insights from Rising Prices and Falling Confidence
Tháng 4 10, 2025Market Overview
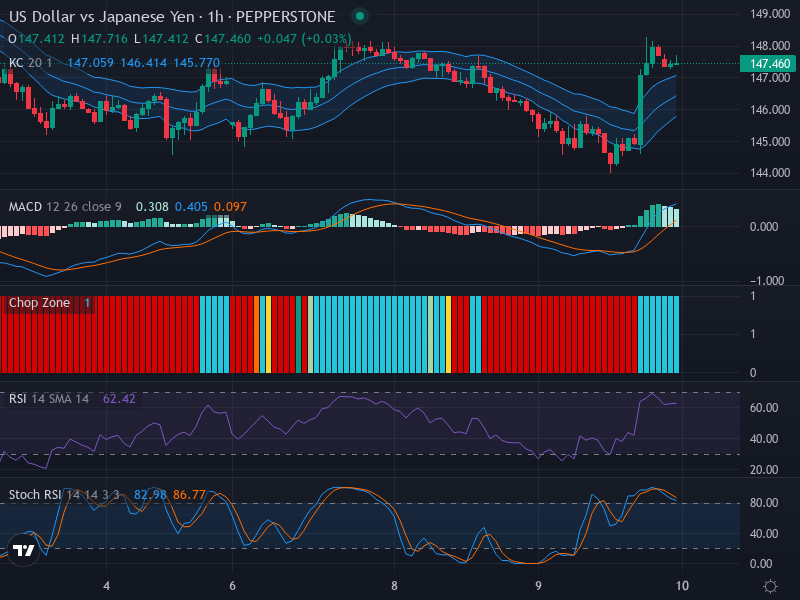
Following a meticulous examination of the recent Forex chart between the US dollar and the Japanese Yen, there has been a noticeable uptick in the bullish behavior of the currency pair. In spite of this upward trend, the markets are treading on cautious grounds as certain indicators, such as the Relative Strength Index (RSI) and Stochastic RSI, toe the line of overbought territory, suggesting a potential reversal or corrective move on the horizon.
Technical Analysis
The prevailing market direction, characterized recently by an upward breakout, underscores a robust bullish pattern. This optimistic stance is highlighted by the breakout above the Keltner Channel, as seen in the recent candlestick patterns. Consequently, the market is braced to anticipate either a surge beyond the 147.77 mark or a retracement towards the 146.41 level.
Investigating the RSI reveals a moderate-to-overbought positioning with a current value of 62.42. While this supports the prevailing upward price trend, it also calls for caution as it approaches what is often deemed overbought territory. Notably, there is no clear RSI divergence observed at this moment.
Further scrutiny of the Stochastic RSI engenders a sentiment of caution against expecting sustained upward momentum. This follows recent activity where the K line, currently at 82.98, crossed below the D line at 86.77, hinting at a potential reversal or corrective move.
On a brighter note, MACD analysis continues to support the current bullish sentiment. The MACD line stands at 0.308, while the signal line is sighted at 0.405. This is coupled with an increase in positive histogram bars, indicating strong bullish momentum. Similar to the RSI, there are no divergences observed within the MACD.
Conclusion and Trading Recommendations
While the general sentiment for the USD/JPY pair leans towards bullish in the short-run, caution is advised due to the potential overbought status suggested by the RSI and Stochastic RSI indicators. There’s an anticipation of a price surge beyond 147.77 or a retracement to 146.41. Traders willing to explore buy opportunities may want to do so if the price continues to escalate. However, it is prudent to maintain a balanced view and monitor potential sell setups if the price corrects towards 146.41.
In the context of the shorter time frames analyzed:
- The 1-week trend shows a sustained bullish momentum with price actions consistently exceeding recent highs.
- The 1-day analysis indicates overbought conditions but lacks immediate reversal signals, suggesting a pause rather than a full-blown correction.
- The 4-hour view illustrates a strong bullish pattern with potential for either continuation or a mild correction, should the price approach the ensuing resistance levels.
Considering all these factors, traders are advised to look for potential entry points at the 1-hour time frame, which may include buyers looking for a bounce off support or sellers anticipating a retracement.
Potential entry points based on this analysis are as follows:
- Buy Entry Point: 147.00, Take Profit Point: 148.00, Stop Loss Point: 146.40.
- Sell Entry Point: 146.30, Take Profit Point: 145.50, Stop Loss Point: 146.80.
Given the current technical landscape, a Buy scenario appears more likely, particularly if bullish momentum persists past the 147.77 resistance level.


