
GBPUSD: Predictive Market Analysis and Sentiment Impact
Tháng 4 20, 2025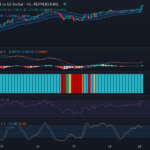
A Comprehensive Analysis of the Bullish Surge in GBP/USD – 21/04/2025
Tháng 4 20, 2025Market Overview
Currently, the Gold versus US Dollar (XAU/USD) is showing notable performance in Forex charts, hitting a price of $3349.14. Marked by a series of higher highs and higher lows, the market is unmistakably inclining toward a consistent uptrend. This bullish performance echoes the growing appetite of traders for safer assets amid the economical unpredictability.
Technical Analysis
The crux of the current market tendency lies within the insightful examination of various technical indicators and chart patterns. We notice a cascade of bullish candlesticks which signal heightened upward momentum. These patterns underscore optimistic buyer sentiment, further fueling the uptrend.
Interestingly, retracement zones are expected around the $3310 to $3320 mark. These zones might provide attractive buying opportunities should the market take a temporary hit and retreat slightly before resuming its upward trajectory.
Looking into the analysis of the Relative Strength Index (RSI), the current RSI value stands at 64.62. This value is telling us that while the buying interest is robust, it’s also close to reaching an overbought status. This suggests that buyers may need to slow down a bit, which might lead to plausible short-term market pullbacks.
Cross examining this with the Stochastic RSI, where the K-value is at 98.57 and the D-value is at 89.37, it only echoes the overbought market conditions. Yet, their placement, with the K-line standing above the D-line, indicates the continuation of a bullish momentum.
The Moving Average Convergence Divergence (MACD) adds a layer of confirmation to this bullish perspective. With the MACD line cruising above the signal line, a bullish crossover becomes undeniable. The histogram momentum’s rising bars illustrate an increase in bullish momentum.
Lastly, viewing the currency pair through the lens of Keltner Channels and Chop Zone provides another essential trend insight. The price comfortably residing above the middle band is a testament to the long-term uptrend.
Conclusion and Trading Recommendations

Given the strong bullish momentum depicted by numerous indicators and lack of signs for a potential reversal, the Gold vs US Dollar presents a consequently potentially lucrative buying opportunity. Traders may look for buying entries around the retracement zones but should observe the markets for any signs of exhaustion given the nearing overbought circumstances.
Analyzing Time Frames
Examining the technical indicators across different time frames reveals the following insights:
- 1-Week: The trend remains bullish with sustained higher lows, confirming a long-term uptrend.
- 1-Day: The price action shows a minor pullback concern, but support at the retracement zones is strong.
- 4-Hour: Continued bullish momentum is evident, although signs of overbought conditions should be monitored closely.
Potential Entry Points
Considering the analysis and current market conditions:
- Buy Entry Point: $3315, Take Profit Point: $3355, Stop Loss Point: $3300.
- Sell Entry Point: $3355, Take Profit Point: $3315, Stop Loss Point: $3360.
In conclusion, the analysis leans more toward a Buy scenario, given the consistent bullish indicators and the potential for short-term retracement opportunities that align with well-established support levels. However, traders should remain vigilant for signs of market exhaustion in the near term.


