
Prolonged Sideways Trend Expected for USD/CAD – 23/04/2025
Tháng 4 22, 2025
Bearish Dominance Persists in GBP/USD Amidst High Volatility: A Comprehensive Forex Analysis – 23/04/2025
Tháng 4 22, 2025Market Overview
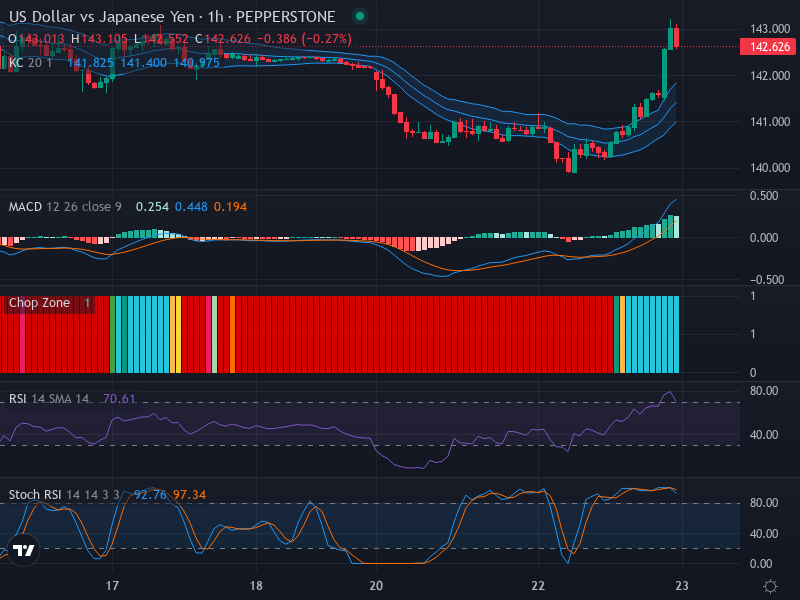
The US Dollar vs Japanese Yen (USD/JPY) appears to be mounting a potentially significant rally, as the trend analysis of the 1-hour chart suggests. Currently priced at 142.626, the currency pair has been following an upward trajectory, underpinned by a series of ascending candles. In tandem with this, the pair remains above the Keltner Channel, signaling a bullish momentum that may push the price further upwards, provided it stays within this territory.
Technical Analysis
An in-depth analysis of candlestick patterns unveils a convincing bullish pattern, primarily characterized by its recent surge. Notably, the currency pair’s price might see further acceleration if it continues to stay aloft the Keltner Channel.
When considering the Relative Strength Index (RSI), it currently sits at 70.61, safely within the overbought zone. While it substantiates the present bullish trend, it also suggests a potential pullback or slowdown due to its location. Hence, this overbought scenario necessitates that investors tread cautiously, as it might indicate an impending retracement or consolidation phase.
Delving into the Stochastic RSI (Stoch RSI), both K Line (92.76) and D Line (97.34) are positioned in the overbought domain. While this consolidation reinforces the existing trend, it also indicates that the momentum for further upward movement might soon diminish. Investors should keep a vigilant eye for any downward crossover, as such an event could signal a counter-trend move if supported by other market signals.
Utilization of Keltner Channels and Chop Zone Indicators further corroborates the bullish trend. The price’s position above the middle band of the Keltner Channels mirrors the ongoing bullish stance. Complementing this is the heightened volatility supported by expanding channels, buttressing the prevailing upward move.
Conclusion and Trading Recommendations
This comprehensive analysis underscores a prevailing bullish wave for the USD/JPY currency pair. The trend seems poised to continue, with the currency pair maintaining its upward climb above the Keltner Channel amidst consistently high volatility. Nevertheless, the overbought conditions highlighted by the RSI and Stochastic RSI indicators indicate a potential slowdown or reversal may be on the horizon.
Therefore, it is advisable for traders and investors to await further confirmations of a price pullback. Purchasing opportunities may present themselves, yet it is vital to conduct due diligence as the potential for reversal looms.
Analysis of Time Frames
Upon reviewing the trends in different time frames, the following observations can be made:
- 1-Week Trend: The USD/JPY exhibits a dominant bullish trend, characterized by consistent higher highs and higher lows.
- 1-Day Trend: The daily trend supports the bullish momentum, showing strong upward movement and positioning above key moving averages.
- 4-Hour Trend: On the four-hour chart, a bullish reversal pattern has emerged, indicating continuation in the near term but also suggesting weakening momentum.
From this comprehensive analysis, potential entry points can be defined on the 1-hour time frame as follows:
- Buy Entry Point: 142.700, with a Take Profit Point at 143.200 and a Stop Loss Point at 142.250.
- Sell Entry Point: 142.500, with a Take Profit Point at 141.900 and a Stop Loss Point at 142.750.
Given the prevailing analysis, the Buy scenario appears more likely to manifest following a potential consolidation or pullback phase, while the overall bullish trend remains strong.


