Gold vs US Dollar: A Neutral to Slightly Bearish Market Scenario – 02/04/2025
Tháng 4 1, 2025
US Dollar vs Japanese Yen: Potential Reversal Points Herald Intraday Opportunities – 02/04/2025
Tháng 4 1, 2025Market Overview
As of late, the NZD/USD currency pair has been a hot topic among forex traders. After a prolonged phase of uncertainty, the recent candlestick chart has revealed a possible bullish reversal. This brings a breath of fresh air for those with stakes in the New Zealand Dollar, as it potentially signals an upcoming value increase against the U.S. Dollar.
Technical Analysis
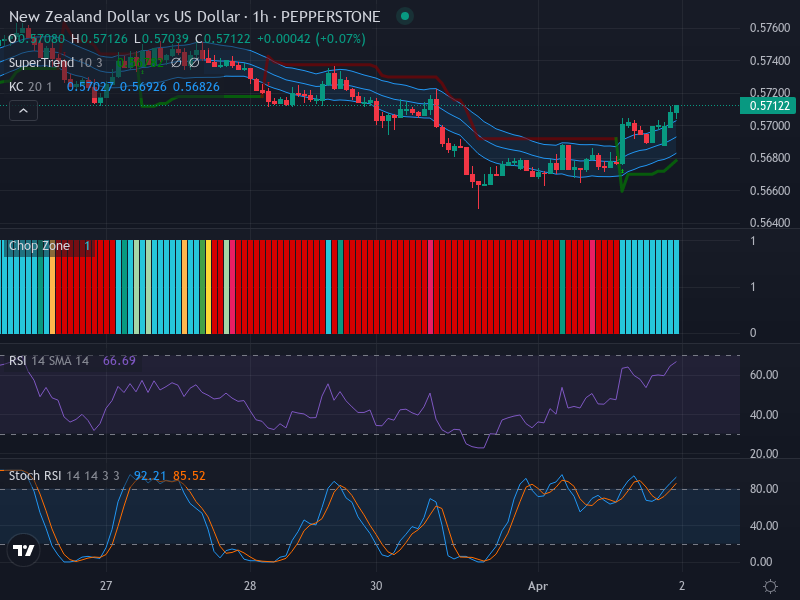
Visually, one bullish candle on the chart has eclipsed the previous resistance, indicating a potential reversal pattern. This breakthrough provides a ray of optimism for bullish traders, especially considering the long-standing bearish dominance. To determine future outcomes, we’ll focus our analysis on two likely zones: resistance around 0.573 and support near 0.568. These will be our guiding points for any upcoming price surges or potential retracements.
Heading over to the Relative Strength Index (RSI), the current value stands at 66.69. It’s edging closer to the coveted 70-mark, loosely translating into an overbought market. Whilst this might provide a mild cushion to the ongoing upward price push, caution is necessary. The lack of a significant divergence for now does not necessarily rule out an imminent one.
Honing into the Stochastic RSI, both K and D lines are currently sitting in the overbought territory with respective values of 92.21 and 85.52. Although these figures further validate the upward price momentum, the stakes of suffering a retracement are high.
Exploring the Keltner Channels and Chop Zone indicators, the price is trending above the middle band, hinting at a persistent bullish pressure. Despite the moderate channel expansion—indicative of increasing volatility—the pair seems to be going strong. The Chop Zone’s predominant red color illustrates the deep resistance encountered, but the visible transition to the upward breakout is a strong bullish indicator.
Conclusion and Trading Recommendations
Balancing the findings, speculation of a bullish reversal for the NZD/USD pair does hold ground. Keeping a close eye on the resistance near 0.573 and support around 0.568 will be crucial.Considering the approaching overbought thresholds on the RSI and the Stochastic RSI, it is recommended to trade cautiously.
Investors who are considering buying should do so at dips near support levels, while sellers could potentially make a profit by selling near the resistance levels if a retracement occurs. Despite the bullish indication, waiting for a more definitive sign might be the best course of action for risk-averse traders.
Market Trend Analysis
Analysis of the 1-week, 1-day, and 4-hour time frames indicates the following trends:
- The 1-week timeframe reflects a consistent bullish trend, confirming strong support at key levels.
- The 1-day analysis illustrates bullish momentum, but overbought conditions suggest potential retracement.
- The 4-hour perspective shows volatility with small retracements, implying traders should be cautious.
Based on the analysis above, potential entry points are recommended at the 1-hour timeframe:
- Buy Entry Point: 0.5700 with a Take Profit Point: 0.5770 and Stop Loss Point: 0.5680.
- Sell Entry Point: 0.5730 with a Take Profit Point: 0.5660 and Stop Loss Point: 0.5750.
You may lean towards a Buy scenario given the current technical indicators suggesting further upward momentum; however, monitoring for retracement signals is essential.