Analyzing USD/JPY: The Bear Trend & Near-term Correction Possibility – 31/03/2025
Tháng 3 31, 2025
Neutral Market Conditions Persisting for USD/CAD: A Forex Market Analysis – 31/03/2025
Tháng 3 31, 2025Market Overview
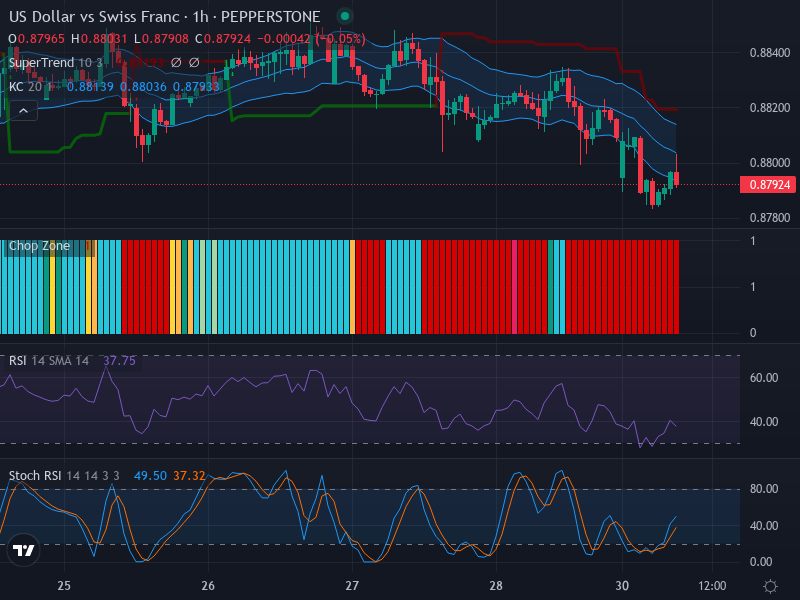
Our spotlight casts on the forex currency pair USD/CHF (US Dollar vs Swiss Franc) as it currently demonstrates its dance on a bearish ballroom. The recent charts illustrate a bearish trend pattern accompanied by periods of consolidation and potential retracements. The ongoing analysis explores these movements in more detail.
Technical Analysis
One can witness the bearish dominance with a sequence of lower highs and lower lows frequently surfacing on the USD/CHF daily chart. The presence of many small-bodied candles amidst these descending movements illustrates periods of price consolidation. Such retracement periods can significantly temper the fierceness of the bearish trend.
Based on our observation, one potential retracement zone has been identified at the 0.87950 level, aligning neatly with historical support. Keen traders may wish to monitor this area for any potential bullish reversals to capitalize on short-term price moves.
Moving on to the Relative Strength Index (RSI), an interesting situation seems to be brewing. The current RSI value sits at 37.75, hinting towards a possibly oversold condition. Contrary to the prevailing bearish sentiment, the RSI indicator suggests a temporary upward retracement may be on the horizon.
Our price study intensifies when we introduce the Keltner Channels and Chop Zone parameters. The Keltner Channel paints a bearish picture with the price comfortably situated below the EMA 20’s middle band most of the time. However, recent slight expansion of the channel might signal an increase in market volatility.
The Chop Zone injects a hint of uncertainty into this mix with bold red bars, painting the landscape of a sideways or ranging market. Looking ahead, traders should keep their eyes peeled for a potential breakout signal, requiring two consecutive candle closes above the upper Keltner Channel while hoping for a neutral Chop Zone.
The Stochastic RSI (Stoch RSI) analysis offers further complexity. The current K and D values, 49.50 and 37.32 respectively, suggest a slight bullish crossover. This intersection fuels further consensus to the idea of a temporary upward move against the underlying bearish ambience.
Conclusion and Trading Recommendations
Based on the comprehensive technical analysis, we expect the prevailing bear trend for the USD/CHF pair to continue, interspersed with potential retracements. Short-term traders might exploit these anticipated retracements, particularly around the noted 0.87950 level. However, the current presence of a sideways market warrants cautious trading; traders should wait for a clear breakout signal above the upper Keltner Channel confirmed by a neutral Chop Zone.
Summary of Time Frame Analysis
- In the 1-week time frame, the trend remains bearish, with lower highs being confirmed by continued selling pressure.
- In the 1-day time frame, consolidation is evident, indicating temporary pauses before downward moves continue.
- In the 4-hour time frame, volatility is low, suggesting limited price action until a breakout occurs.
Potential Trade Entries
- Buy entry point: 0.87950, Take profit point: 0.88400, Stop loss point: 0.87700.
- Sell entry point: 0.87400, Take profit point: 0.86900, Stop loss point: 0.87550.
Analyzing the current indicators and market sentiment, a Buy scenario appears more likely in the short term, especially considering the potential for a retracement at the established support level.