Australian Dollar vs US Dollar: A Detailed Technical Analysis and Potential Trade Opportunities – 29/03/2025
Tháng 3 28, 2025
Ebullient EUR/USD Faces Potential Reversal: A Comprehensive Technical Analysis – 29/03/2025
Tháng 3 28, 2025Market Overview
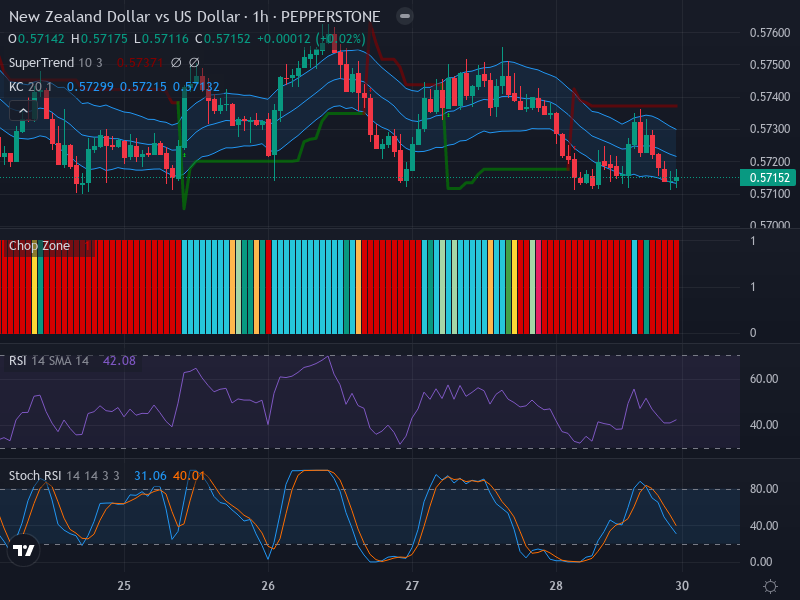
The New Zealand Dollar (NZD) has shown pronounced vulnerability in recent times against the US Dollar (USD), characterized by a recurrent dominance of red candlesticks in the chart. These bearish signals, combined with several critical indicators, suggest an existing downward trajectory in this forex market, painting a considerably unfavorable picture for the NZD.
Technical Analysis
In evaluating the chart patterns, the prevalence of bearish candles is a significant signal indicating a downwards market direction. Further, important potential zones that may define future performance have been identified. Market resistance near 0.573 could potentially obstruct any upward breakouts. Additionally, the support level at 0.571 subtly insinuates that a sturdier force may be necessary to trigger further downward price movements.
The Relative Strength Index (RSI), standing at 42.08, is nestled within a neutral zone, leaning more towards an oversold market situation. This offers an underlying hint towards possible acceleration in selling pressure, and the absence of any significant divergence from the price movement reinforces this indication of a downward trend.
The Stochastic RSI (Stoch RSI), another useful technical indicator, further confirms this. With a K line of 31.06 and D line of 40.01, the former is below the latter, delivering a bearish signal that synergizes with the noted downward momentum. This pattern suggests the potential for extending the downside prior to any reversionary moves.
Moreover, analysis of the Keltner Channels propounds the downward trend. The price observation below the middle band underscores the pronounced long-term downward trend. Additionally, volatility, as indicated by this model, could play a significant role in determining future trends.
Conclusion and Trading Recommendations
In light of the predominant bearish patterns and signals, traders might thoroughly consider a short position on the NZD/USD pair. Nevertheless, keen observation of the market is recommended, especially for resistance and support levels around 0.573 and 0.571, respectively. Any potential reversals should also be observed through the Stoch RSI.
1-Week, 1-Day, and 4-Hour Trend Analysis
In the 1-week time frame, the trend remains predominantly bearish, suggesting that the NZD/USD pair will likely continue its downward path. The 1-day time frame indicates increasing momentum in bearish pressure, reinforcing the need to position for potential declines. Meanwhile, the 4-hour time frame shows consolidating bearish activity, which could lead to further selling opportunities.
Potential Entry Points
For traders looking to capitalize on this analysis, potential entry points have been identified:
- Buy Entry Point: 0.575, Take Profit Point: 0.578, Stop Loss Point: 0.572
- Sell Entry Point: 0.570, Take Profit Point: 0.565, Stop Loss Point: 0.573
Given the overwhelming bearish indicators, the Sell scenario appears more likely to occur. This aligns with the continuous downward pressure observed across multiple time frames, providing traders with a strategic way to approach this market.