
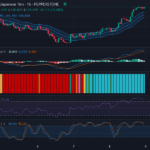
US Dollar vs Japanese Yen: A Rally towards Resistance Amidst Overbought Conditions – 09/05/2025
Tháng 5 8, 2025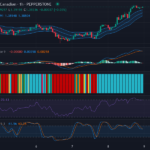
Bullish Momentum Sustains for USD/CAD; Overbought Conditions may Herald Volatility – 09/05/2025
Tháng 5 8, 2025Market Overview
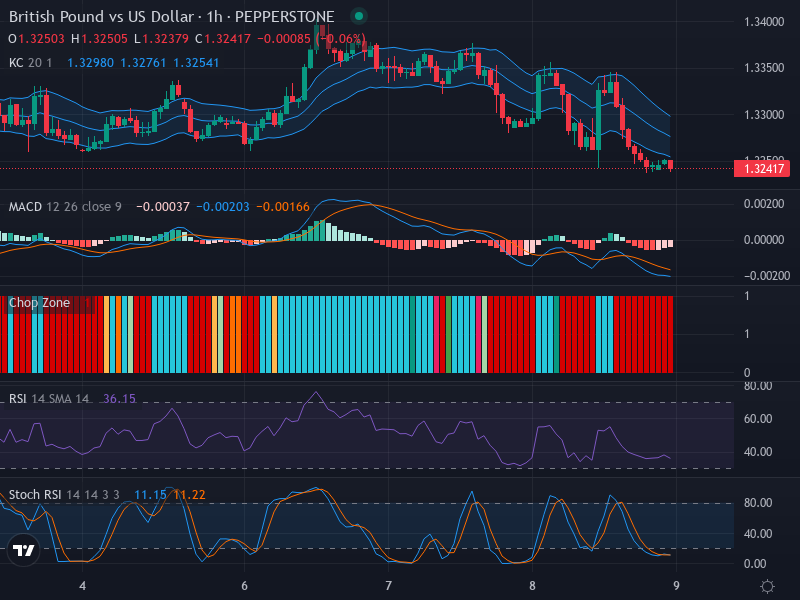
At the time of placing the spotlight on the British Pound (GBP) against the US Dollar (USD), the pair is currently being exchanged at 1.32417. The currency pair has been indicating a dominant downward market direction, even showing signs of minor bearish candles which could potentially signify a retracement. In the grand scheme of things, one could not overlook certain key zones representing resistance and support fronts near 1.33000 and 1.32000 respectively.
Technical Analysis
Delving into the world of technical indicators, the study of the Relative Strength Index (RSI) exhibits an oversold condition as it presently stands at 36.15. Such ostensible oversold circumstances tend to support our premise concerning the continuation of the ongoing downward trend in this currency pair. Although, there’s no distinct divergence observed currently, which is usually indicative of a potential trend reversal.
On another note, the Stochastic RSI indicator, with K and D lines at 11.15 and 11.22 respectively, is essentially supporting our bearish outlook. Both of these lines are dwelling in the oversold territory which is another testament to a possible turn in the pair’s fortunes, furthermore corroborating the downward trend in GBP/USD.
The Moving Average Convergence Divergence (MACD) analysis has also revealed interesting insights. With a MACD line value of -0.00037 and Signal Line value at -0.00203, we are witnessing a strategic confirmation of bearish movement consistent with the RSI and Stochastic RSI readings. The falling histogram bars are providing us with a clear hint of a growing bearish momentum.
Lastly, inspecting the Keltner Channels and Chop Zone, the ongoing bearish trend is reaffirmed by the current price dwelling below the EMA 20 middle band. Increased channel expansion indicates a surge in volatility levels. The continued stretch of colored bars (red) signposts a quote-unquote accumulation zone, maintaining our stance on the market moving in a downward trend. A potential breakout, however, was not observable at the time of this examination.
Conclusion and Trading Recommendations
Based on the foregoing technical analysis, the predominant bearish momentum in the GBP/USD Forex pair is quite evident. Traders could likely consider trading short, capitalizing on the apparent downward trend. However, due to the pair entering the oversold region as pointed out by the RSI and Stochastic RSI, there is a certain possibility of a market reversal. Therefore, stringent stop-loss measures are recommended if considering a short position to protect against potential upside risk.
In examining the 1-week, 1-day, and 4-hour time frames for additional clarity:
- In the 1-week timeframe, we observe a consistent downtrend, reaffirming the bearish momentum with no immediate signs of reversal.
- Over the 1-day timeframe, the pair shows signs of temporary retracement but remains firmly below key resistance levels, supporting a selling strategy.
- Within the 4-hour timeframe, minor corrections are noted, yet the overall trend persists downward, which correlates with the longer-term bearish sentiment.
Possible entry points in the 1-hour timeframe are derived as follows: the Buy entry point can be established at 1.32500, aiming for a Take Profit point at 1.32800, with a Stop Loss point set at 1.32350. Conversely, the Sell entry point could be at 1.32350, with a Take Profit point at 1.32000 and a Stop Loss point at 1.32400. Based on the analysis and indicators, a Sell scenario appears more likely to occur at this juncture.


