US Dollar vs Swiss Franc: Mixed Indicators Point to a Prevalent Sideways Trend – 29/03/2025
Tháng 3 28, 2025
Bearish Pressures Rising for the New Zealand Dollar Against the US Dollar – 29/03/2025
Tháng 3 28, 2025Market Overview
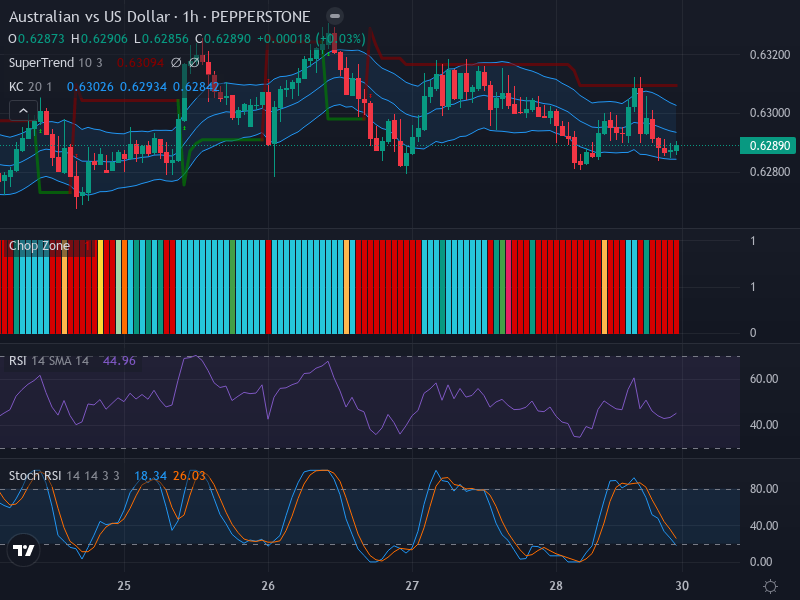
The foreign exchange market is currently witnessing a period of low volatility between the Australian Dollar (AUD) and the US Dollar (USD). The pair is exhibiting a sideways movement, with prices operating within a relatively confined range. This fluctuating nature of the currency pair, coupled with the continuous appearance of small candlesticks on the chart, suggests a phase of market indecision.
Technical Analysis
The AUD/USD forex chart is characterized by a lack of clear direction, prompting a close examination of various technical indicators.
Candlestick Pattern Analysis
In the immediate past, the chart’s candlestick patterns have been modest in size, indicating low market volatility and indecision. The currency pair seems to be trudging along a lateral path, fluctuating within a constrained price range. Critical price points to monitor are a resistance level at 0.6296 and a support level around 0.6280, which if breached could lead to significant price movements.
Relative Strength Index (RSI) Analysis
The RSI stands at 44.96, indicating a rather neutral to slightly bearish market sentiment. The RSI does not point towards any overbought or oversold conditions in the immediate term, and it’s not diverging from the current price trend, reinforcing the ongoing indecisiveness.
Keltner Channel and Chop Zone Analysis
The Australian vs US Dollar pair is hovering around the midpoint of the Keltner Channel, indicating an absence of a clear long-term trend. The Chop Zone also substantiates this observation with its incessant colored bars signifying a high degree of disorder within the sideways market. At present, no potential breakouts are visible as the prices stay confined within the Keltner Channels.
Stochastic RSI (Stoch RSI) Analysis
The Stoch RSI presents a potential warning sign against bullish momentum. Both the K and D lines (18.34 and 26.03, respectively) recently signaled a downward cross, implying potential bearish momentum.
Conclusion and Trading Recommendations
Given the current market conditions, the AUD/USD pair is likely to continue its trendless or sideways direction in the short-to-medium term. Traders should exercise caution against bullish bets considering the potential bearish momentum revealed by the Stoch RSI. Close monitoring of the resistance and support levels, along with any breaches thereof, could provide potential trading opportunities.
Analysis of Time Frames
1-week: The trend shows neutral sentiment with no clear breakout direction, maintaining a steady range.
1-day: The currency is teetering at critical resistance and support levels, indicating potential for volatility if breached.
4-hour: Short-term movements suggest bearish pressures but reinforce the need for close monitoring of support and resistance.
Based on the analysis of technical indicators and market sentiment, here are the potential entry points:
- Buy Entry Point: 0.6300, Take Profit Point: 0.6320, Stop Loss Point: 0.6275.
- Sell Entry Point: 0.6280, Take Profit Point: 0.6260, Stop Loss Point: 0.6295.
The current analysis suggests that a Sell scenario is more likely to occur, given the indications of bearish momentum along with the lack of bullish support in the market.