
April ISM Services Index: A Beacon of Growth Amid Manufacturing Struggles
Tháng 5 5, 2025
NZDUSD Currency Pair: Trends, Resistance Levels, and Future Predictions
Tháng 5 5, 2025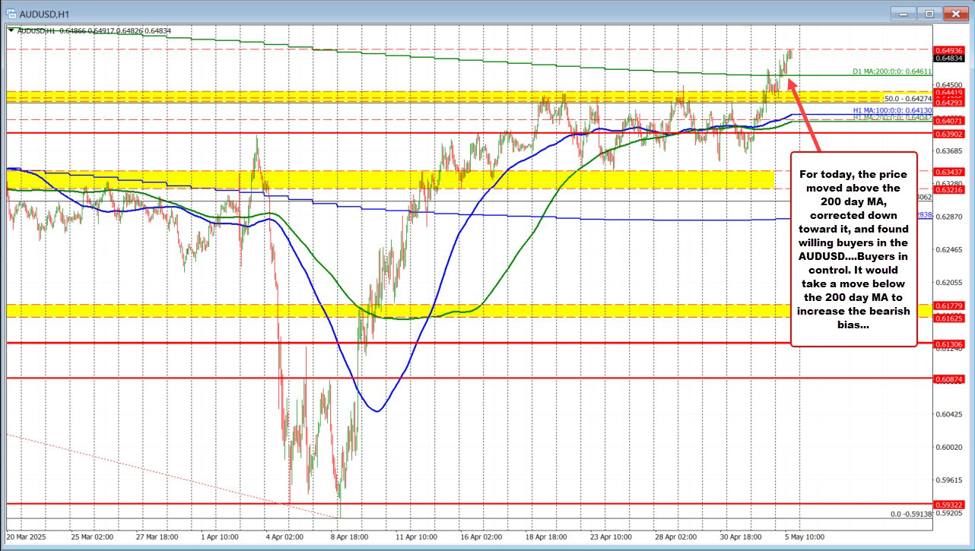
AUD/USD Breaks Above Key 200-Day Moving Average: What It Means for Traders
The AUD/USD currency pair has just crossed a significant technical milestone by surging above its crucial 200-day moving average (MA), currently sitting at approximately 0.6461. This breakout is not just a mere fluctuation in the financial markets; it marks a bullish signal that positions the pair for its first close above this critical threshold since November 2024. A movement above the 200-day MA is often viewed as a strong indication of a trend reversal or the strengthening of an existing trend, and in this case, traders are eyeing potential gains ahead.
Recent Technical Analysis
The initial struggle of the AUD/USD pair to maintain momentum above the 200-day MA and the resistance level at 0.64687 was palpable. However, recent trading sessions have seen a regaining of that momentum, with the pair confidently establishing itself above this pivotal resistance level. This behavior typically indicates increased buying pressure and a shift in market sentiment towards a more optimistic outlook for the pair.
It’s crucial to note that the bullish push in AUD/USD has coincided with a decline in the USD/CNH exchange rate, which has fallen by about 100 pips. This decline has played a supportive role in bolstering the Australian dollar against its American counterpart, further enhancing the bullish trend observed in AUD/USD. Traders should consider this inter-market correlation as a vital indicator of factors influencing the currency pair’s movement.
Meanwhile, traders navigating the forex landscape may also want to keep an eye on the GBP/USD currency pair, which is currently trading within a neutral range. The GBP/USD is reflecting limited volatility and a lack of strong patterns that warrant caution during trading sessions. More details can be found in this analysis here.
Potential Resistance Levels Ahead
As the AUD/USD holds its ground above the 200-day MA, market participants are keenly looking at potential resistance levels that may either confirm new highs or provoke a pullback. Analysts believe that if this upward motion is sustained, the currency pair could push towards the next resistance level at 0.6535. Beyond this point lies the 61.8% Fibonacci retracement mark at approximately 0.6548, which traders often regard as a significant price point reflecting potential resistance or support.
Moreover, keeping an eye on movements in the EUR/USD could also provide valuable insights, as the pair is displaying slight upward trends amidst consolidation. An understanding of these dynamics can benefit traders as they track potential breakout or bounce scenarios. For a detailed analysis, refer to this article.
The convergence of technical indicators and chart patterns suggests that the market sentiment is gradually tilting favorably for the Aussie dollar. This optimistic outlook has resulted in growing bullish signals, leading many traders to reevaluate their positions in anticipation of further gains for the AUD/USD pair.
Conclusion
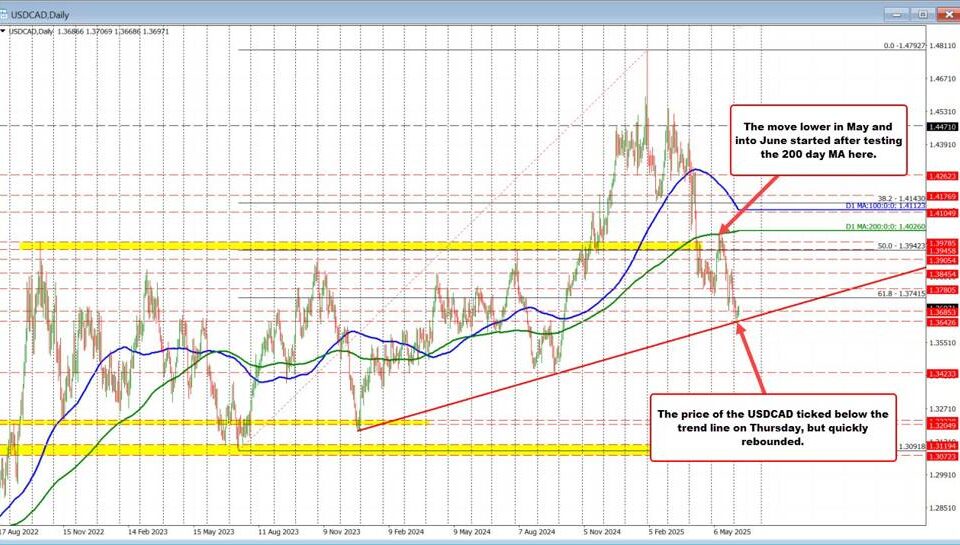
The recent technical breakthrough of the AUD/USD above the 200-day moving average marks a pivotal moment for traders, characterized by renewed optimism and a potential shift in market sentiment. As it navigates towards upcoming resistance levels, the pair’s ability to maintain this upward trajectory will largely depend on a number of factors, including broader market conditions and the interplay with other currency pairs. Traders should remain vigilant, monitoring these developments closely as they could create valuable opportunities in the dynamic currency markets. Additionally, it may be worth keeping track of the neutral trends observed in the USD/CAD as noted here.