GBP/USD Analysis – A Detailed Study of Sideways Action Amid Market Consolidation – 31/03/2025
Tháng 3 31, 2025
Bearish Trend Interspersed with Potential Retracements: An In-depth Examination of USD/CHF – 31/03/2025
Tháng 3 31, 2025Market Overview
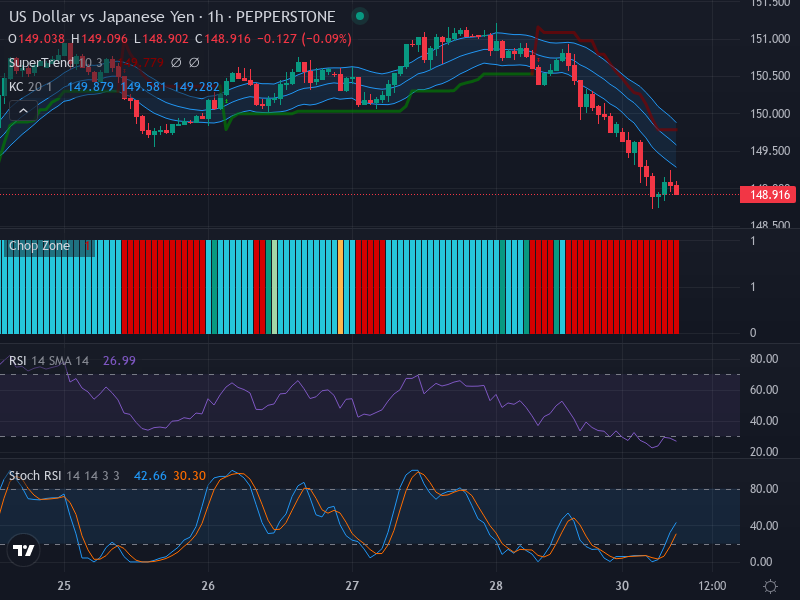
The USD/JPY currency pair has experienced a steady downtrend paired with increased volatility over the past hours. The bearish stance is quite pronounced, resulting in an oversold market, largely driven by heightened global economic tensions. Investors have sought refuge in safe-haven currencies such as the Yen, influencing this downward trajectory.
Technical Analysis
An in-depth examination of the 1-hour chart reveals a continuous series of bearish candlesticks, which are prominent indicators of an ongoing downward trend. Notably, there are no evident reversal patterns, such as hammers or bullish engulfing formations, which suggests that further price decreases may be on the horizon. Nonetheless, the 148.50 zone has emerged as a significant potential support and rebound area worth monitoring.
The market’s Relative Strength Index (RSI) currently sits at a low of 26.99, signaling an oversold condition. This may indicate that a potential reversal or upward corrective move could occur in the near future. It is important to highlight that there is no notable RSI divergence, which aligns with the prevailing downward price trend.
The Stochastic RSI also paints an interesting picture. The K line, reading 42.66, has crossed above the D line at 30.30, which is typically interpreted as an impending bullish shift. The gradual increase in Stoch RSI values supports the likelihood of a short-term price correction, working against the overall bearish momentum.
Further analysis reveals that the price remains below the mid-point of the Keltner Channels, reinforcing the continuing downtrend. Additionally, the Chop Zone, predominantly red, underscores the current strong trend and high volatility in the market. Without a close outside the Keltner Channel paired with a neutral Chop Zone, the bearish sentiment is likely to persist.
Conclusion and Trading Recommendations
In conclusion, while the USD/JPY showcases a solid bearish trend, the possibility of a temporary price correction should not be overlooked. Traders are advised to adopt a wait-and-see approach, closely monitoring the key support level at 148.50, possible corrections due to the oversold RSI, and anticipated shifts suggested by the Stoch RSI.
Despite the potential for a short-term bullish move, it is vital to evaluate these against the overarching bearish trend.
Trend Analysis Summary:
- 1-week timeframe: The trend remains decisively bearish, with the downward pressure expected to continue due to macroeconomic factors.
- 1-day timeframe: The bearish momentum persists, although occasional corrections may offer brief respite.
- 4-hour timeframe: Overall trend indicates a strong downward movement, but fluctuations are noted which could signal minor rebounds.
Given this analysis, potential entry points at the 1-hour timeframe include:
- Buy Entry Point: 148.50, Take Profit Point: 149.50, Stop Loss Point: 148.00.
- Sell Entry Point: 147.80, Take Profit Point: 146.80, Stop Loss Point: 148.20.
Overall, the analysis leans towards a Sell scenario being more likely in the current context, considering the prevailing bearish trend reinforced by technical indicators.