Technical Analysis Review: EUR/USD Faces Potential Downward Pressure Amid Neutral Signals – 07/05/2025
Tháng 5 6, 2025
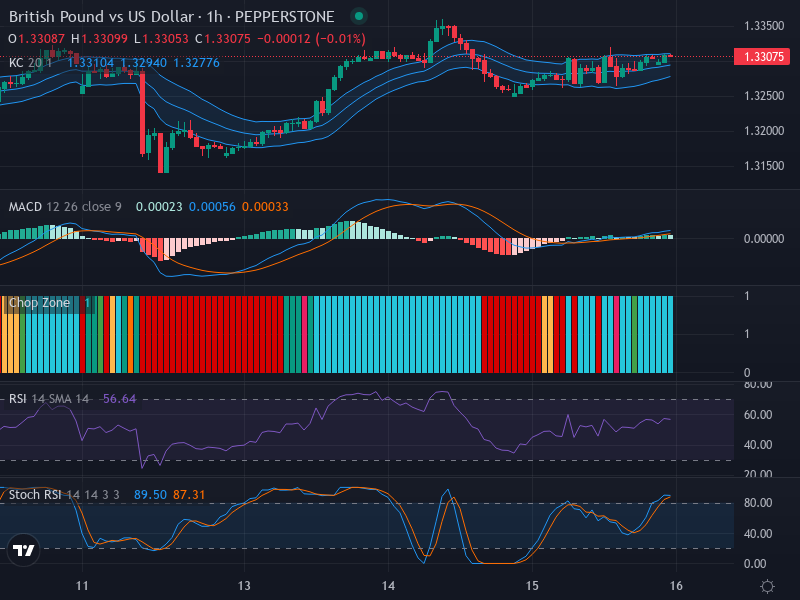
Analyzing Potential for Bullish Continuation – GBP/USD at a Glance – 07/05/2025
Tháng 5 6, 2025Market Overview:
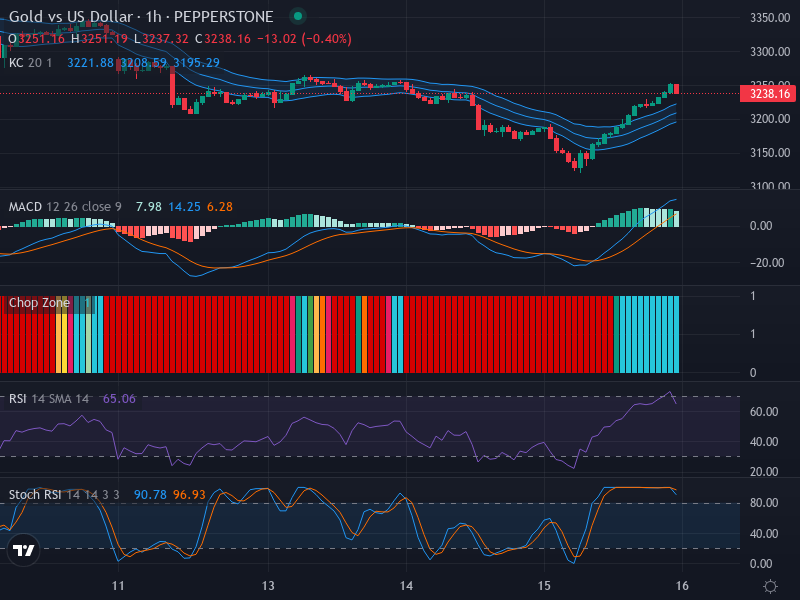
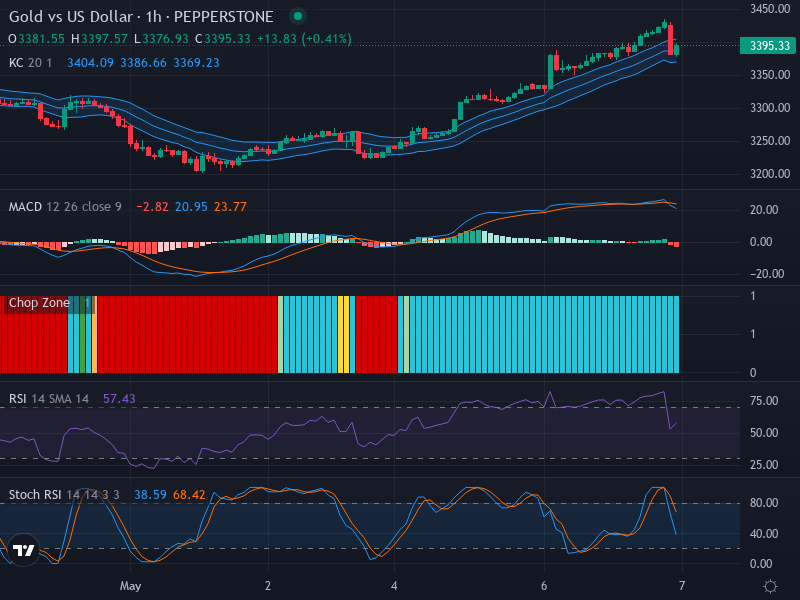
At present, the Gold vs US Dollar market is exhibiting bullish indications, with the current price standing at 3395.33. Over recent periods, a series of green candles have evinced an ascending trend, albeit punctuated by a slight correction indicated by a preceding red candle. According to the Keltner Channels, this rogue red candle could potentially signal a retracement zone set around the current price level.
Technical Analysis:
The candlestick pattern does reveal a bullish trend, but the emergence of a small correction heralds potential retracement, aligning with the middle band of the Keltner Channels. This shift in the direction of the market hints at the possibility of market consolidation before the bullish trend re-establishes itself.
Analyzing the Relative Strength Index (RSI) delivers a value of 57.43, epitomizing the Forex market’s neutral footing. This neutral zone suggests that the market trend is free from immediate reversal indicators, and the ongoing trend has room for sustenance.
The ‘Keltner Channels and Chop Zone Analysis‘ has elucidated that price being above the middle band (EMA 20) supports a sustained, longer-term uptrend. Coupled with the Chop Zone‘s turquoise bars, it is fair to anticipate a maintained trend, albeit without strong evidence of a potential breakout. The analysis fails to confirm this due to the absence of two consecutive candles closing outside the Keltner Channels.
The Stochastic RSI scrutiny estimates values of 38.59 for the K Line and 68.42 for the D Line. The discrepancy between the two illustrates no robust crossover confirming immediate market changes. However, the current values do provide a cautionary tale of a potential pullback within the overall bullish trend.
The MACD analysis was inconclusive due to incomplete data. Nevertheless, up to a value of -2.82 for the MACD Line, a downtrend was discernible compared to the Signal Line.
Conclusion and Trading Recommendations:
In light of the above analysis, the Gold vs US Dollar market’s immediate direction leans toward a bullish trend with potential consolidation or retracement in the short term. As the RSI continues to hover within the neutral zone, traders might look forward to this zone’s end to identify possible trading opportunities.
Given the ongoing bullish trend (despite a potential pullback in the offing), recommendations lean towards ‘Buy’. Yet, traders should monitor the market closely for a confirmed breakout from the Keltner Channels before finalizing their trading decisions.
Trend Analysis:
- 1-Week Trend: Bullish overall momentum, with potential for a short-term consolidation phase.
- 1-Day Trend: Mixed signals with indications of a retracement, yet the overall bullish momentum remains intact.
- 4-Hour Trend: Signs of a pause with a minor correction observed, but subsequent upward movement is expected.
Potential Entry Points:
- Buy Entry Point: 3395.50; Take Profit Point: 3410.00; Stop Loss Point: 3385.00.
- Sell Entry Point: 3378.00; Take Profit Point: 3365.00; Stop Loss Point: 3388.00.
In this scenario, the conditions favor a Buy scenario due to favorable indicators suggesting a broader bullish trend, despite the recent fluctuations. However, traders are advised to remain vigilant to avoid potential losses amid market corrections.