
Forex Technical Analysis Insights for April 11, 2025 – 11/04/2025
Tháng 4 10, 2025
Gold vs US Dollar: Upward Surge But Overbought Conditions Point To Possible Retracement – 11/04/2025
Tháng 4 10, 2025Market Overview
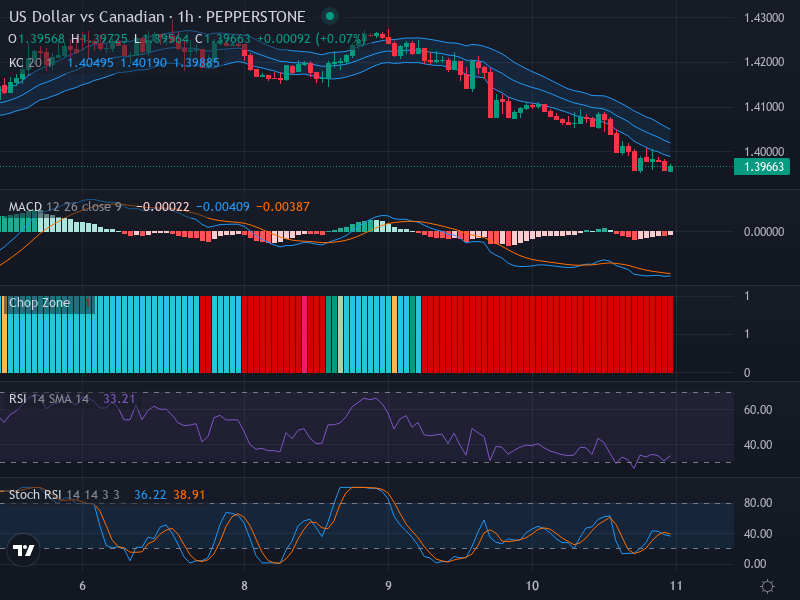
In today’s trading, the USD/CAD currency pair has been subjected to significant bearish movements, currently hovering around the 1.39663 mark. This decline can be attributed to the strengthening Canadian dollar in contrast to its US counterpart. Given the ongoing downtrend and key technical indicators, it appears that the pair may remain under bearish pressure in the short term.
Technical Analysis
A closer examination of the latest candlestick patterns indicates a persistent downtrend for the USD/CAD pair. The presence of multiple small bearish candles illustrates a dominant bearish sentiment in the market. Important technical levels have been identified, with considerable support expected around the 1.3950 mark and resistance likely obstructing retracements near 1.4000.
The Relative Strength Index (RSI) currently indicates a value of 33.21, approaching the oversold threshold. While reinforcing the bearish trend, this also hints at a potential slowdown or reversal in momentum over the near term.
Similarly, the Stochastic RSI suggests bearishness with the K line positioned below the D line at 36.22 and 38.91 respectively. This emphasizes the bearish momentum, yet it also implies that the downward potential could be somewhat limited.
The MACD analysis underpins the bearish sentiment, as the MACD line remains below the signal line. However, the decreasing histogram bars suggest a decrease in the likelihood of making fresh record lows, indicating that the downward pressure could be somewhat constrained.
Utilizing the Keltner Channels and Chop Zone analysis, we find a consistent view where price action remains beneath the EMA, suggesting that bearish pressures dominate the current trend.
Conclusion and Trading Recommendations
In summary, the analysis indicates that the immediate outlook for USD/CAD remains bearish. However, the indicators also signal a potential near-term stabilization. Traders should consider shorting opportunities until clear reversal signals materialize, ensuring they set appropriate stop-loss levels just above the nearest resistance at 1.4000.
Trend Analysis by Time Frame
- 1-Week Time Frame: The overall market trend remains firmly bearish, with sustained downward pressure visible through consistent lower highs and lower lows.
- 1-Day Time Frame: A continuation of the bearish momentum is evident, but with some signs of weakening pressure suggesting a possible short-term bounce.
- 4-Hour Time Frame: The bears are still in charge, but the RSI and Stochastic indicators indicate a potential for a corrective move soon, potentially providing traders a retracement opportunity.
Potential Entry Points
- Buy Scenario: Entry point around 1.3980, with a potential take profit at 1.4020 and stop loss at 1.3950. This setup bets on a minor retracement to test the resistance level.
- Sell Scenario: Entry point at 1.3950, with a take profit around 1.3900 and a stop loss set at 1.4000. This position capitalizes on the bearish trend continuing towards support levels.
Overall, the analysis leans towards a Sell scenario being more likely given the prevailing bearish sentiment across the indicators.


