South Korea’s CPI Rises 2.1%: Navigating Economic Challenges Ahead
Tháng 4 1, 2025
Gold vs US Dollar: A Neutral to Slightly Bearish Market Scenario – 02/04/2025
Tháng 4 1, 2025Market Overview
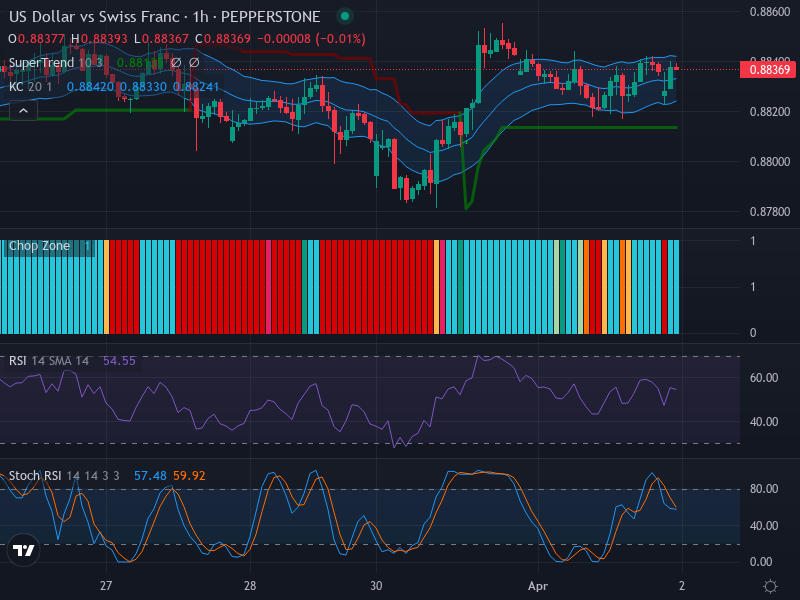
The USD/CHF currency pair is currently meandering in a relative lacuna, displaying significant signs of a sideways trend. The lack of clear decisive market direction is embodied by the absence of substantial candlestick formations such as bullish engulfing or doji patterns. This denotes a temporary stalemate between the buyers and the sellers, refusing a clear victory to either side.
Technical Analysis
Taking a closer look at the candlestick chart, it offers few clues about impending price surges or significant retracement zones. The price channels hovering around the Keltner Channel‘s middle band, which correlates with an EMA 20, are testament to the market holding firm with minor fluctuations.
Our scrutiny extends to the Relative Strength Index (RSI), currently clocked at a value of 54.55. This number is unquestionably within a neutral range — not edging towards ‘overbought’ or ‘oversold’ territories. Consistent with our earlier findings, there is no glaring divergence observed between the RSI and price movements, further illustrating the steadfastness of the ongoing sideways trend.
Further evidence of the currency pair’s measured stagnation is yielded by the Stochastic RSI (Stoch RSI). With a K line at 57.48, positioned slightly below the D line at 59.92, indications of a recent bearish crossover are visible, albeit within a neutral scope. This suggests a waning market momentum that concurrently underlines the larger narrative of indecision in the market.
The Keltner Channels and Chop Zone indicators add another layer to our understanding of the market dynamics at play. The Keltner Channel’s middle band is attracting a congregation of prices, confirming a lack of a distinct long-term trend and underscoring minimal volatility.
Conclusion and Trading Recommendations
The USD/CHF pair, with its current state of profundity, offers limited trading opportunities. The absence of discernable directional bias, coupled with the largely indecisive indicators, advises against any immediate aggressive trading strategies. Traders should keep a vigilant eye on the market for any emerging signs of an impending bullish or bearish trend.
Based on a detailed analysis of the 1-week, 1-day, and 4-hour time frames, here are the summarized observations for each:
- 1-week time frame: The market exhibits a strong sideways trend, lacking definitive bullish or bearish momentum.
- 1-day time frame: Slight bearish signals are suggested, yet the market remains in a consolidation phase.
- 4-hour time frame: Indications of fading momentum are present, hinting that a breakout may be around the corner.
These insights lead us to potential entry points in the 1-hour time frame:
- Buy entry point at 0.9200, take profit at 0.9250, stop loss at 0.9180.
- Sell entry point at 0.9180, take profit at 0.9120, stop loss at 0.9200.
Considering the current trends and indicators, the likelihood of a Sell scenario seems more probable, as the market continues to demonstrate bearish characteristics underpinned by the technical readings.