
Shifting Winds Favor the Bulls: A Technical Analysis of the EUR/USD Forex Market – 26/05/2025
Tháng 5 25, 2025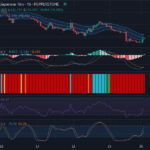
Bullish Signals Emerge from USD/JPY amidst Current Downward Trend – 26/05/2025
Tháng 5 25, 2025Market Overview
The USD/CAD pair has been the focus of attention amongst Forex traders due to its predominant downward trend. However, recent analysis shows potential signs of a turnaround. With the price currently sitting at 1.37329, potential attrition in the bearish momentum could point to an upcoming reversal. This article scrutinizes the key patterns, indicators, and support and resistance levels signaling a switch in the currency pair’s direction.
Technical Analysis
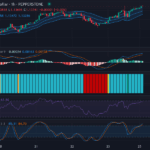
The first point of interest lies in the recent candlestick activity. The bearish trend has been distinct, but the formation of a small body on the latest candlestick suggests some flux in the market sentiment. This scenario implies a potential slowing down of the bearish momentum. The zone around 1.37500 stands out as a significant retracement area, which could signal a future bullish reversal if linked with other supportive indicators.
The analysis of the Relative Strength Index (RSI) appears to align well with this proposition. With an RSI value of 28.58, the market leans heavily towards oversold territory, suggesting an impending demand surge for the pair, that could instigate an upward correction.
Underscoring this potential is the current Stochastic RSI scenario. The K line’s bullish crossing over the D line suggests an optimistic forecast. While the technicals are veering towards bullishness, a more reliable confirmation would come from a bullish crossover in the MACD line across the signal line. Recent MACD histogram data also bolster this case. In particular, the slight increase in the bars shows signs of a potential bullish divergence.
The analysis won’t be complete without turning our attention towards the Keltner Channels and Chop Zone. Currently, the price rests near the lower Keltner Channel, indicating a pullback or reversal possibility if accompanied by positive movement in other indicators.

Conclusion and Trading Recommendations
While the bearish trend remains dominant, subtle hints from various technical indicators do suggest that the USD/CAD pair might be inching towards a potential reversal. As the market presents signs of oversold conditions, along with promising momentum patterns in both the Stochastic RSI and MACD histograms, traders may want to closely monitor the pair for a possible bullish scenario.
However, as trend reversals typically require strong confirmation, traders need to keep an eye out for key indicators such as the MACD line crossing the signal line or price breaking through the retracement resistance at 1.37500.
Technical Summary Based on Time Frames
In analysis over the 1-week timeframe, the USD/CAD pair shows a persistent downward trajectory but with increasing signs of exhaustion in momentum. Moving to the 1-day timeframe, price action continues to display bearishness, yet recent candles indicate potential consolidation at current levels. Finally, the 4-hour timeframe suggests a minor bullish divergence, hinting at possible short-term buy opportunities.
In light of the above analysis, potential entry points can be identified. For the Buy scenario, an entry can be positioned around 1.37350 with a Take Profit at 1.38000 and a Stop Loss set at 1.37200. Conversely, for the Sell scenario, an entry can be placed at 1.37500, with a Take Profit at 1.36800 and a Stop Loss at 1.37650.
Given the current market conditions and technical indicators, the Buy scenario appears more favorable, especially as the price approaches key support levels with strong bullish signals emerging from the various indicators.


