
A Comprehensive Overview of the Gold vs US Dollar Market – 25/04/2025
Tháng 4 24, 2025
USD/JPY: Augmenting Momentum Amid Neutral Market Dynamics – An Examination of Greenback’s Subtle Gain Against Yen – 25/04/2025
Tháng 4 24, 2025Market Overview
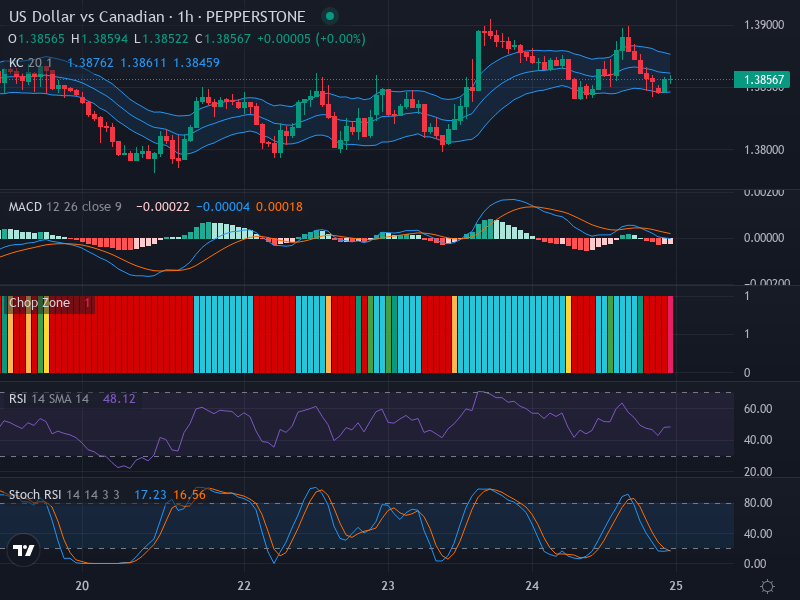
The US Dollar vs. the Canadian Dollar (USD/CAD) complex has been evidently strolling on a sideways path in recent times. The market, notwithstanding the absence of a clear-cut dominant trend, shows possible signs of trend transition. The current market price of USD/CAD stands at 1.38567, and the data exhibits a noticeable indecision among traders through conspicuous candlestick patterns.
Technical Analysis
Candlestick Patterns
Delving into the candlestick patterns gives an evident illustration of the existing market indecision. This is highlighted by the presence of smaller bodies combined with wicks; hallmarks of a potential sideways movement. The market trend thus leans laterally, indicating stability rather than a bullish or bearish predisposition.
Key Zones
Chart scrutiny reveals Resistance potentially forming near the upper Keltner Channel line, close to the 1.38612 mark. Conversely, chart support seems to be creeping into the picture somewhere near the lower channel, around 1.38459. These zones are crucial for traders as they serve as the boundaries for this market’s short-term price fluctuations.
Relative Strength Index (RSI)
The RSI value at 48.12 reinforces the concept of neutrality. It indicates a balanced market, disproving any potential for overbought or oversold scenarios. The RSI underscores the lateral market movement by showing no distinct trend direction.
Stochastic RSI (Stoch RSI)
Claimed to be oversold due to low key values (K Line: 17.23, D Line: 16.56), Stoch RSI prompts a deeper analysis. All current signs point to the absence of immediate buying triggers, but they do simultaneously highlight the possibility of upward momentum, hinting at a potential bullish future.
Moving Average Convergence Divergence (MACD)
The MACD line stands at -0.00022 and the Signal line is at -0.00004. Despite being slightly negative, the MACD histogram gives away subtle signs of a neutral-to-bullish market mood, once again backing the possibility of momentum gathering on the bullish side.
Conclusion and Trading Recommendations
Given the overall sideways trend hinting towards a possible upward momentum, traders might want to consider building their strategy around these insights. Performing additional extensive research before jumping into the market would, as always, be advised.
The lack of prominent buying signals indicates that immediate trading action might not be required, and a good strategy could be to wait and observe the trend development with a close eye on those oversold conditions. Ultimately, the onset of a potential bullish momentum should be looked out for.
Trend Analysis:
- 1-week timeframe: The market displays a sideways movement with a potential for upward momentum. The absence of strong momentum indicators suggests consolidation rather than a decisive trend.
- 1-day timeframe: The sideways movement continues, although short-term bullish indicators are starting to appear, suggesting trader interest might rise.
- 4-hour timeframe: Indicators show possible bullish signals forming, but overall sentiment remains cautious, characterized by the sideways channel.
Potential Trading Entry Points:
- Buy entry point: 1.38580, Take profit point: 1.38800, Stop loss point: 1.38450.
- Sell entry point: 1.38450, Take profit point: 1.38200, Stop loss point: 1.38550.
Taking everything into account, the analysis leans slightly towards a Buy scenario being more likely, as there are growing signs of a potential bullish trend emerging.


