
Lateral Movement in Pound versus Dollar: A Close View of GBP/USD’s Forex Chart – 10/04/2025
Tháng 4 9, 2025
Bullish Momentum Climbs for the US Dollar Against the Japanese Yen Despite Overbought Cautions – 10/04/2025
Tháng 4 9, 2025Market Overview
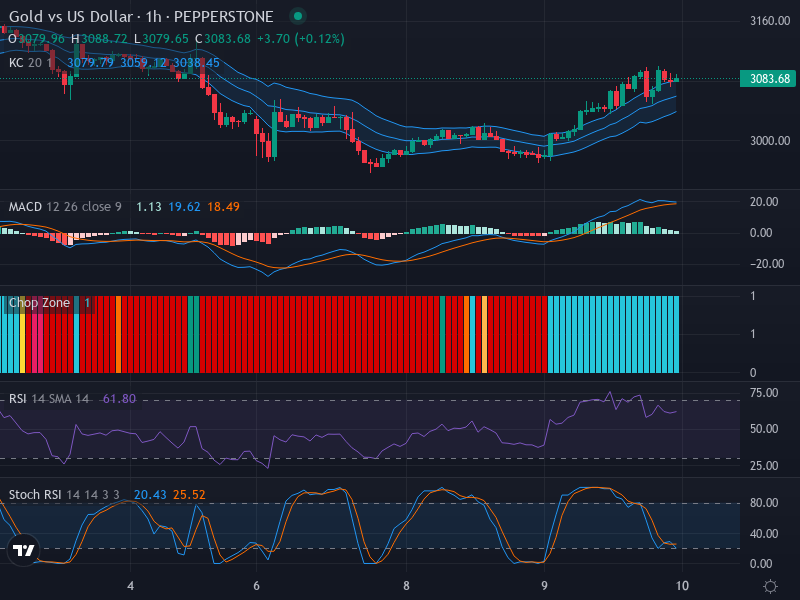
The foreign exchange market currently exhibits a continued bullish sentiment regarding Gold against the US Dollar. This trend is mainly indicated by a progressive series of bullish candlesticks that have surpassed the middle band of the Keltner Channel. However, it’s important to emphasize that no definitive candlestick patterns, such as bullish engulfing or doji, are evident at this time, suggesting potential volatility and room for fluctuations in the market.
Technical Analysis
When we assess the Candlestick Pattern Interpretation, the upward trend shows moderate strength and stability. There exists a potential for price retracement if gold prices fall below the Keltner Channel, signaling possible resistance at the channel’s upper limit, which may lead to short-term consolidation.
Turning our focus to the Relative Strength Index (RSI), which currently stands at 61.80, it indicates a neutral to slightly overbought market condition. This level suggests a moderate upward momentum without immediate signs of overselling or overbuying pressure. Notably, the RSI shows no significant divergences from the current price movement, highlighting a harmonious market condition.
An examination of the Stochastic RSI reveals potential divergence from prevailing market trends. The Stochastic RSI’s K line is currently at 20.43, with the D line at 25.52, indicating an imminent bullish crossover in the oversold territory. This situation suggests a possible shift in momentum towards an upward move, which contrasts the ongoing consistent bullishness.
Delving into the Moving Average Convergence Divergence (MACD), we observe a bearish crossover, as evidenced by the MACD line at 1.13, falling below the signal line at 19.62. The slightly negative histogram reinforces the notion of weakening upward momentum, implying a potential start of consolidation.
Conclusion and Trading Recommendations
In conclusion, after a careful analysis of various technical indicators and market patterns, it’s clear that while the Gold vs US Dollar market is largely in an upward trend, there are emerging signals indicating possible retracements. Diverging insights from the Stochastic RSI and the MACD suggest a forthcoming short-term bearish crossover, proposing potential consolidation.
Traders are encouraged to closely monitor price actions for any definitive bullish or bearish patterns that may inform their trading strategies. Given the Stochastic RSI in overbought conditions, a cautious approach would be beneficial, particularly avoiding any additions to long positions until clearer market signals emerge.
Analysis of Time Frames
- 1-Week Time Frame: The overall trend remains bullish but is showing signs of slowing momentum. Market players should remain alert for any significant shifts that could indicate a reversal.
- 1-Day Time Frame: Price actions suggest potential for short-term volatility. The Keltner Channel indicates resistance, while price swings may create opportunities for quick trades.
- 4-Hour Time Frame: While currently still bullish, indicators show possible upcoming consolidation or retracement, warranting caution for traders looking for entry points.
Based on the analysis across these time frames, traders can leverage the following potential entry points:
- Buy Entry Point: 1925.00, Take Profit Point: 1940.00, Stop Loss Point: 1915.00.
- Sell Entry Point: 1918.00, Take Profit Point: 1905.00, Stop Loss Point: 1925.00.
Given the analysis at hand, the likelihood of a Buy scenario is more favorable if the market shows sustained upward momentum without retracing below critical support levels.


