USD/JPY Technical Analysis: Unveiling Potential Bullish Reversal Amid Stochastic RSI’s Overbought Signals – 01/04/2025
Tháng 3 31, 2025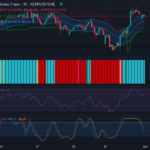
Sideways Market Unfolding: A Comprehensive Analysis on the USD/CHF Forex Pair – 01/04/2025
Tháng 3 31, 2025Market Overview
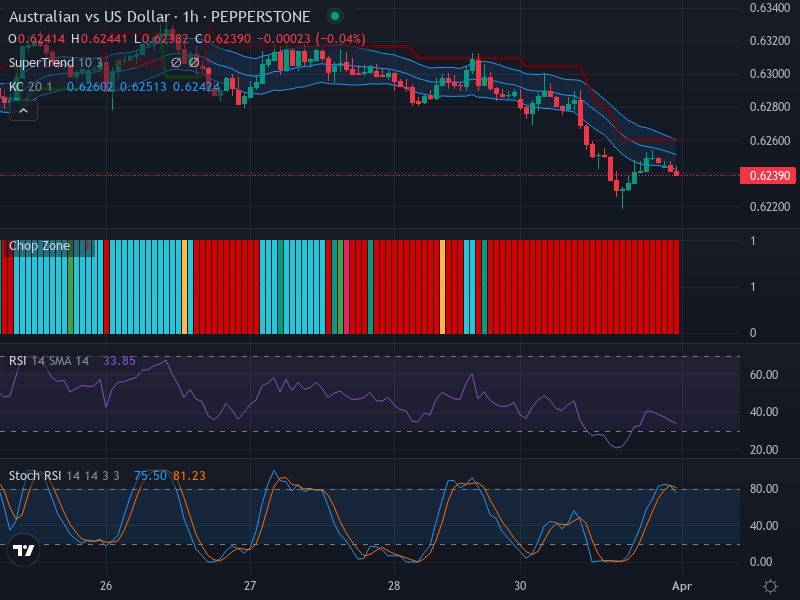
The Australian Dollar against the American Dollar (AUD/USD) has notably been treading a downward path over recent weeks. The one-hour forex chart shows a clear bearish trend marked by lower highs and lower lows. The market, however, is currently exhibiting signs of consolidation, indicative of slightly reduced volatility in the short term. Despite the prevalent bearish market, a potential retracement zone seems evident around the 0.62600 marks.
Technical Analysis
The analysis of candlestick patterns has revealed minor indicators of a potential trend shift or market correction. Small body candles, often identifiable during consolidation periods, hint at the possibility of a decrease in market turbulence. On the flip side, the simultaneous presence of lower highs and lower lows suggests that the market could still lean towards a bearish direction.
The Relative Strength Index (RSI), which currently stands at 33.85, suggests a neutral to bearish momentum. Although there are no clear divergences between the asset’s price and the RSI’s position, the nearing oversold condition is mildly suggestive of a bearish movement.
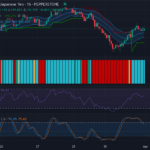
Consulting the Keltner Channels indicator, we find more robust affirmations of a bearish sentiment: the price is primarily hanging below the middle band, and the moderate channel expansion implies an increased degree of volatility.
In concurrence, the Chop Zone indicator displaying a bold red color confirms the continuing bearish market’s reign and underscores a low level of disorder prevalent in the market.
The Stochastic RSI, an advanced version of the straightforward RSI, signals an overbought market situation with K=75.50 and D=81.23, hinting at potential future reversal or pullback. Furthermore, the crossover of K over D subtly supports the continuation of the bearish momentum.
Conclusion and Trading Recommendations
Overall, the AUD/USD pair demonstrates a continuing downtrend over the one-week period, backed by strengthening bearish signals. In the short-term perspective of a single day, potential signs of consolidation could suggest a minor pause or slowing down of the bearish momentum.
To further analyze the situation, we can break down the trends in various time frames. Over the one-week period, the trend remains decidedly bearish as confirmed by stubborn lower price peaks. On the one-day chart, consolidation points suggest potential indecisiveness in the market. Meanwhile, the four-hour chart still reflects bearish momentum but shows some minor signs of retracement potential, signaling traders to remain vigilant.
Traders might consider taking a cautious approach, considering the overbought Stochastic RSI, the potential near oversold condition of the RSI, and the evident consolidation in the candles. Waiting for a clear signal of reversal or break of current consolidation could be a prudent strategy for the moment.
Proposed Trading Opportunities
- Buy Entry Point: 0.62650, Take Profit Point: 0.62800, Stop Loss Point: 0.62500
- Sell Entry Point: 0.62450, Take Profit Point: 0.62300, Stop Loss Point: 0.62550
Based on the analysis of the indicators, the current market conditions, and the signals indicated by the various time frames, a Sell scenario appears more likely in order to take advantage of the continuing bearish trend.