
UK Retail Sales Trends: Insights & Forecasts for 2025
Tháng 4 24, 2025
A Comprehensive Technical Analysis: USD/CAD Suspected Sideways Movement & Possible Bullish Momentum – 25/04/2025
Tháng 4 24, 2025Market Overview
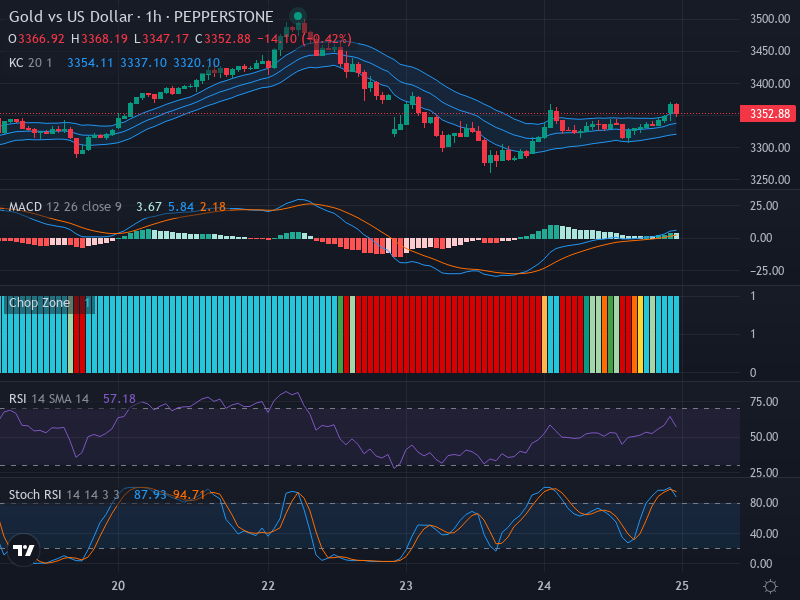
The Gold vs US Dollar currency pair presents an intriguing scenario. After witnessing a stretch of descending candlesticks, the market appears to have settled into a consolidation pattern at its current position of 3352.88. Despite the lateral trend direction seen in recent trading sessions, signs of a potential upward turn are emerging for experienced market-watchers.
Technical Analysis
The currency pair has marked out clear resistance and support levels around 3375 and 3330, respectively. The resistance level coincides with the point where preceding highs were tested, while support levels correspond to recent lows. However, with the market sailing in sideways territory, an ascending breakout might just cut through this gloom.
When it comes to the Relative Strength Index (RSI), which currently measures at 57.18, the inferences are neutral yet slightly tilting to positivity. Given the RSI’s approach to the higher end of the neutrality zone, traders can reasonably anticipate a bullish momentum. The RSI lends itself favorably to predictions of a potential short-term uptick in market action.
On the flip side, the Stochastic RSI analysis reveals that both the K value (87.93) and the D value (94.71) are in the overbought zone. This suggests the necessity of caution despite the bullish crossover of K over D, signaling potential upward price action. The overbought status denotes a high probability of the current momentum reaching its peak soon.
The Moving Average Convergence Divergence (MACD) analysis further supports this optimistic prospect. A bullish crossover is evident, as the MACD line (5.84) is above the signal line (2.18). This reiterates the possibility of a bullish momentum.
Conclusion and Trading Recommendations
In light of the above analysis, a moderate to slightly bullish perspective imbibes the current market. Traders would be wise to cautiously monitor for an upcoming bullish breakout while also staying alert to the signs suggesting near exhaustion of the current upward momentum.
Technical Analysis Summary
- 1-Week Time Frame: The trend suggests a moderate bullish sentiment with potential for upward movement but watch for possible corrections.
- 1-Day Time Frame: Short-term indicators are leaning towards a bullish breakout, although caution is warranted due to overbought signals.
- 4-Hour Time Frame: Consolidation is evident; watch for critical breaks above resistance or drops below support levels.
Entry Points
Buy Entry Point: 3360 with a Take Profit Point at 3390 and a Stop Loss Point at 3345.
Sell Entry Point: 3310 with a Take Profit Point at 3280 and a Stop Loss Point at 3330.
Based on the analysis, a Buy scenario appears more likely given recent momentum, but traders must remain vigilant of potential reversals and manage risk appropriately.


