
Bullish Gold Continues to Shine against US Dollar: A Comprehensive Technical Analysis – 21/04/2025
Tháng 4 20, 2025
US Dollar vs Canadian Dollar: Potential Reversal in Sight Amid Oversold Conditions – 21/04/2025
Tháng 4 20, 2025Market Overview
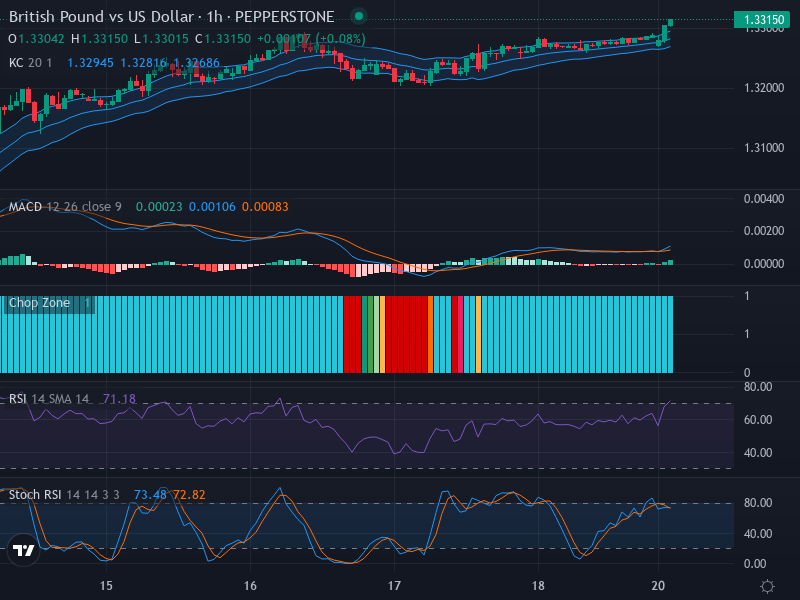
The GBP/USD currency pair has lately been exhibiting a bullish trend. The current price is resting at 1.33150, and the most recent indicators suggest a continuation of this upward momentum. This stance is primarily confirmed by a corresponding hike above the limit of the Keltner Channels and the relative consolidation of this position.
Technical Analysis
Delving into the specifics of the current GBP/USD chart, a set of carefully studied key technical points emerges, providing a holistic perspective on potential market movements.
Firstly, focusing on the candlestick pattern interpretation, a noteworthy bullish momentum can be observed. This is chiefly represented by the strong upward price movement surpassing the Keltner Channels’ upper barrier. Furthermore, if the price sustains above this level, it could pave the way for a potential price surge, indicating possible substantial future strength in this pair.
Taking a closer look at the Relative Strength Index (RSI), it is currently at 71.18, clearly situated in the overbought territory. This suggests that the pair might be due for a potential price retracement or stabilization in the short term. Moreover, the lack of significant RSI divergence supports the proclamation of a short-term bullish trend for now.
Moving on to the Stochastic RSI (K: 73.48, D: 72.82), we identify a crossover in said overbought vicinity. This is typically an early warning sign of a possible price retracement or consolidation, contesting the dominance of the current bullish momentum.
Finally, an analysis of the Moving Average Convergence/Divergence (MACD) displays a bullish crossover, with the MACD line traversing above the signal line. Coupled with the rising histogram bars, this implies an escalating bullish momentum. This bullish MACD attests the overbought RSI condition, reinforcing the case for a short-term bullish trend.
Conclusion and Trading Recommendations
Considering all the derived analytics, the GBP/USD pair retains strong bullish potential for the time being, despite signals of possible price retracement or stabilization from the RSI and Stochastic RSI. Therefore, traders are advised to monitor these conditions closely and consider entering bullish positions while exercising caution. The foreground possibility of temporary price pullback should not be dismissed.
Analysis of Multiple Time Frames
To further solidify the trading decisions, let’s look at the trends on different time frames:
In the 1-week time frame, the market shows a robust bullish trend overall with the price maintaining a position above the key moving averages. In the 1-day time frame, we observe fluctuations but with an overarching upward momentum, hinting at sustained strength. As for the 4-hour time frame, slight bearish signals arise with indications of possible pullbacks, though the overall market structure remains bullish.
Based on the collection of analyses from these time frames, here are the potential entry points:
- Buy entry point: 1.33150, Take profit point: 1.34000, Stop loss point: 1.32700.
- Sell entry point: 1.32800, Take profit point: 1.32000, Stop loss point: 1.33100.
Given the current market sentiment, it appears that the Buy scenario has a higher probability of realization compared to Sell opportunities, hence the emphasis on entering long positions while balancing risk management.


