
Forex Technical Analysis Update – 28th April 2025 – 28/04/2025
Tháng 4 27, 2025
Gold vs US Dollar: An In-Depth Forex Analysis Awaits a Trend Decision – 28/04/2025
Tháng 4 27, 2025Market Overview
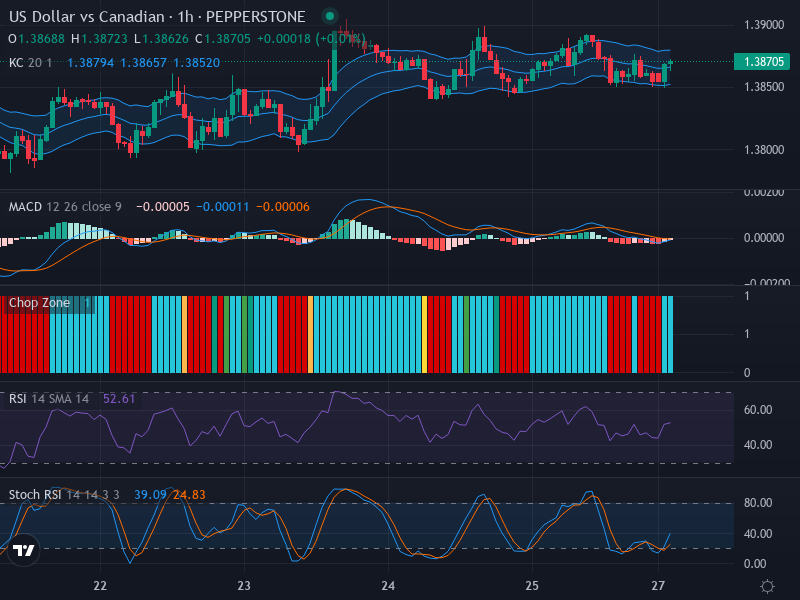
The USD/CAD currency pair is teetering on the edge of expectation as it shows signs of a slight uptrend. Presently, the market is settling around the 1.38705 price level. Participants are not seeing broad movements either way as mixed indicators reveal a lack of solid trend direction.
Technical Analysis
A closer look at price action reveals that recent candlesticks have short bodies, signifying a cul-de-sac of investor indecision. The currently observable minor uptrend seems to lack powerful backing, suggesting potential for a pullback near the immediate resistance zone around 1.38800.
Simultaneously, the Relative Strength Index (RSI) is in equilibrium, hovering around 52.61. This mid-level positioning indicates a stable market that leans slightly toward bullish zones but lacks the energy for a breakout.
The Stochastic Relative Strength Index (Stoch RSI) tells a similar tale; despite a modest bullish crossover in its nascent stage, indicated by a K Line at 39.09 and a D Line at 24.83, figures still dwell below the crucial 50 mark, suggesting a need for caution until these bullish hints are confirmed.
The Moving Average Convergence Divergence (MACD) analysis supports the evidence of potential positivity as well. With the MACD Line marginally converging toward the Signal Line, and the histogram showing decreasing bearish momentum, signs are pointing to a possible upward trend reversal.
Providing a counterpoint to this optimism, the Keltner Channels and Chop Zone indicators suggest a market with directional uncertainty. The price oscillation is around the middle band, and the Chop Zone flashes mixed colors indicating a sideways market. This highlights the potential for increased volatility amid strong fluctuations.
Conclusion and Trading Recommendations
In light of the aforementioned technical insights, although there is a minor leaning towards bullish territory, a full-fledged rally seems to lack momentum. Traders are recommended to position themselves for potential upside moves while being prepared for possible retracements or moderate price fluctuations.
1-Week, 1-Day, and 4-Hour Trend Analysis
In the 1-week time frame, the market shows a slight bullish trend but encounters resistance at higher levels. In the 1-day time frame, prices are fluctuating without specific direction, indicating indecision among traders. The 4-hour time frame confirms a minor uptrend, though it remains vulnerable to sudden reversals.
Potential Entry Points
Given the analysis of various indicators, I suggest the following potential entry points:
- Buy Entry Point: 1.38750, Take Profit at 1.39000, Stop Loss at 1.38500.
- Sell Entry Point: 1.38600, Take Profit at 1.38400, Stop Loss at 1.38850.
Analyzing these scenarios, it appears that a Buy scenario is more likely to occur, provided the market momentum continues to slightly favor the bullish indicators.


