
Strengthening Ties: The Historic China-Brazil Summit and Its Global Implications
Tháng 5 12, 2025
Gold vs US Dollar: Navigating the Downward Trend – 13/05/2025
Tháng 5 12, 2025Market Overview
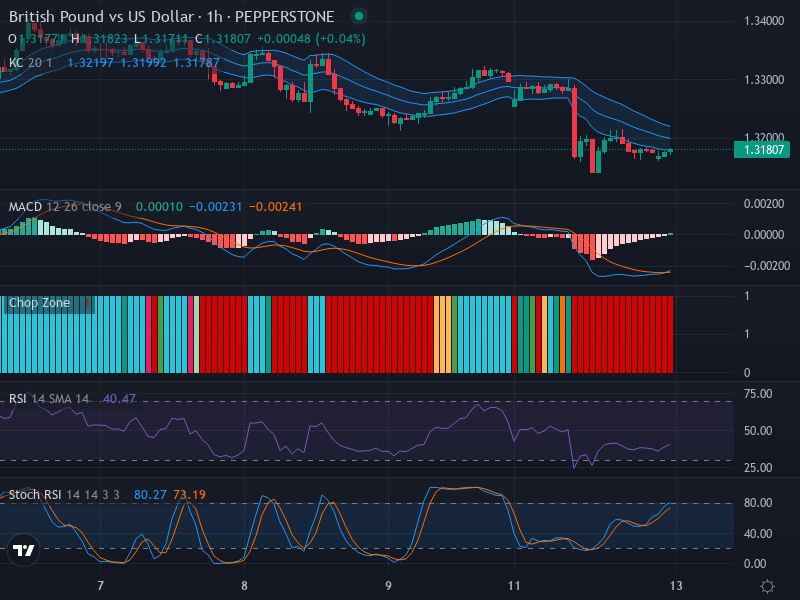
The GBP/USD Forex pair has been demonstrating a moderate downtrend in recent sessions. The current market price stands at 1.31807, with potential retracement zones identified near the 1.3200 level. The trend does not present any notable bullish reversal patterns such as bullish engulfing or hammer, indicating the prevalence of bearish sentiment in the market for the time being. However, certain indicators point towards a potential resistance to the downtrend soon.
Technical Analysis
Analyzing the Relative Strength Index (RSI), it has been identified that the index stands at 40.47, hovering somewhere between neutral and near-oversold territory. This could mean that the downward trend might face resistance, albeit the market hasn’t reached an extremely oversold territory yet to ensure that a reversal is imminent.
Similarly, the examination of Keltner Channels along with the EMA 20 (Exponential Moving Average) band shows the price lies beneath the middle band, corroborating the ongoing bearish trend. Meanwhile, the consistent red bars in the Chop Zone analysis further validate a strong trending market, sidelining a sideways market move.
Switching focus to the Stochastic RSI indicators, the K and D lines stand at 80.27 and 73.19, respectively. The positioning of the K line above the D line and their location in the overbought territory may suggest an impending bearish momentum, especially if a crossover occurs.
Moreover, the Moving Average Convergence Divergence (MACD) stands at 0.00010 for the MACD line and -0.00231 for the signal line. A weak bullish crossover is observed as the MACD crosses above the signal line. However, confirmation from other indicators to support this is lacking due to the current weak trend.
Conclusion and Trading Recommendations
Based on the analysis presented, the GBP/USD Forex pair is currently in a moderate bearish trend, with several indicators hinting at a potential slowdown in the bearish momentum. Traders need to tread cautiously, considering the lack of strong confirmation for a trend reversal. The analysis of the recent trend suggests:
- 1-week timeframe: The bearish trend appears consistent, showing no significant signs of reversal.
- 1-day timeframe: The downtrend is maintaining strength, with indicators suggesting possible temporary resistance.
- 4-hour timeframe: Short-term oscillations indicate a potential for retracement, but the overall momentum remains bearish.
Potential entry points can be established on the 1-hour timeframe:
- Buy Entry Point: 1.3200 | Take Profit Point: 1.3250 | Stop Loss Point: 1.3150.
- Sell Entry Point: 1.3150 | Take Profit Point: 1.3100 | Stop Loss Point: 1.3180.
In light of the current analysis, the Sell scenario appears more likely to occur unless strong confirmation signals from the indicators emerge indicating a change in trend.


