
Bullish Engulfing Fuels Rally: A Comprehensive EUR/USD Technical Analysis – 03/04/2025
Tháng 4 2, 2025
Hong Kong’s IPO Market Soars: The DeepSeek AI Effect
Tháng 4 3, 2025Market Overview
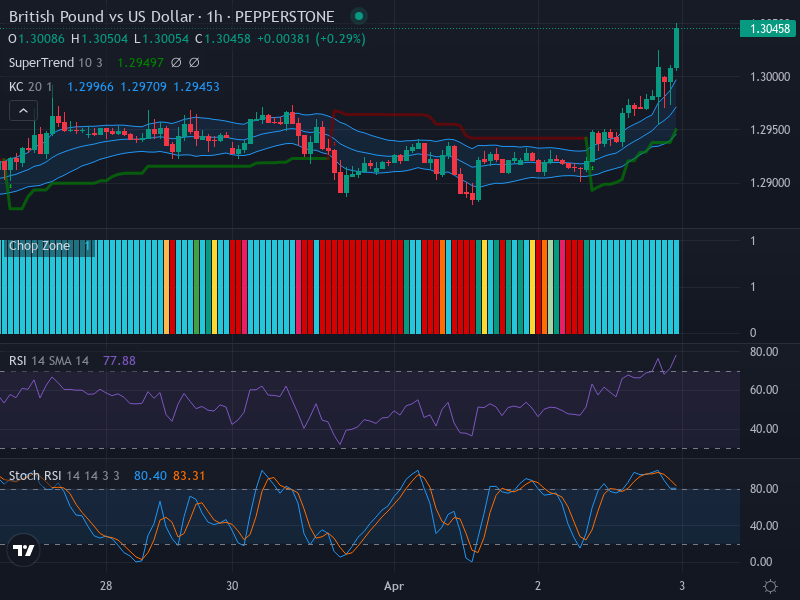
The exchange rate for the British Pound (GBP) against the US Dollar (USD) shows an upward trend, as indicated by the prevailing bullish candlestick patterns. The market direction is largely directed above the resistance level of 1.3000, hinting at a potential surge. However, some caution is required as the momentum could lead to a retracement towards the 1.2950 level.
Technical Analysis
Central to this recent bullish trend in the GBP/USD market are specific technical indicators, each revealing interesting aspects of the ongoing market behaviours.
In studying the Relative Strength Index (RSI), the pair’s current value stands at a high 77.88; this is indicative of an overbought market. While this does support the hope for an ongoing price trend, warning signs of a possible reversal or consolidation phase cannot be ignored. However, the absence of a noticeable RSI divergence also suggests that this upward trend momentum will likely continue, at least in the short term.
An examination of the pair’s Keltner Channels and the Chop Zone also conveys a similar message. The GBP/USD pair’s price has closed above the upper band of the Keltner Channels, which is typically a signal pointing towards a strong upward trend coupled with increasing volatility. The Chop Zone bars revealing predominant shades signal a reduction in market disorder and a possible directional movement. Particularly noteworthy is the formation of two consecutive candles closing outside the Keltner Channel, which highly suggests a sustained breakout.
The pair’s Stochastic RSI is also worth analyzing. Its K line stands at 80.40, with the D line registering at 83.31. A crossing of the K line below the D line in the overbought zone can be interpreted as a potential pullback or slowing momentum in the near term.
Conclusion and Trading Recommendations
Taking into consideration the various technical analyses, the GBP/USD pair seems primed for a bullish continuation. However, the overbought market conditions necessitate some caution. Traders can look to establish long positions, particularly if the price breaks out above the 1.3050 level. Stay alert to signs of weakening momentum that might signal a pullback towards the 1.2950 level.
1-week Trend Analysis: The overall market appears bullish, with strong upward momentum evidenced by the weekly moving averages pointing higher. Potential pullbacks should be monitored as these could provide better entry points.
1-day Trend Analysis: Daily charts reflect stability above the 1.3000 threshold, with fluctuations expected around this level, suggesting a likely bullish continuation barring drastic external news.
4-hour Trend Analysis: The 4-hour timeframe shows shallow corrections after breakout, indicating sustained interest from buyers and an overall bullish sentiment, but with increased vigilance towards overbought conditions.
Potential Entry Points:
- Buy Entry Point: 1.3050, Take Profit Point: 1.3150, Stop Loss Point: 1.2980.
- Sell Entry Point: 1.2950, Take Profit Point: 1.2850, Stop Loss Point: 1.3010.
In conclusion, given the current market analysis, a Buy scenario seems more likely to occur, especially if GBP/USD maintains trading above 1.3000 and exhibits strong bullish signals.


