Gold vs. US Dollar: Bullish Momentum Faces Overbought Conditions – 03/04/2025
Tháng 4 2, 2025
GBP/USD Set For Bullish Continuation Amid an Overbought Market: A Comprehensive Analysis – 03/04/2025
Tháng 4 2, 2025Market Overview
The forex market is buzzing with the growing upward momentum in the EUR/USD currency pair, substantiated by recent candlestick formations and several technical indicators. As the trend guidance remains strong, it’s critical to have a grounded understanding of the involved nuances and potential money-making opportunities.
Technical Analysis
Candlestick Pattern Analysis
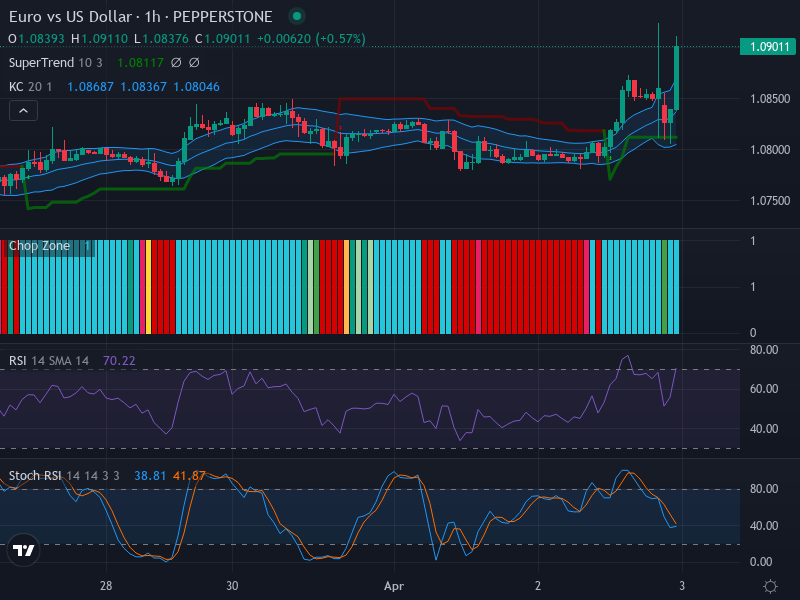
The EUR/USD pair exhibits a bullish engulfing pattern, a compelling indicator forecasting a switch in sentiment amongst traders. This pattern, composed of a smaller red candlestick shadowed by a larger subsequent green one, foreshadows a potential shift towards a bullish market. It is particularly noted that the last green candle’s closing above prior price highs further validates the upward direction and suggests that the bulls have assumed market control.
Technical Indicators Examination
Take note of the Relative Strength Index (RSI), sitting at 70.22. This value leans towards the overbought boundary, insinuating the current upward movement is nearing saturation. Although it doesn’t negate the positive trend, a persistence of overbought readings might predict a temporary drawback.
As for the Stoch RSI, the K line positioned at 38.81, just below the D line at 41.87, might trigger a short-term pullback. Nonetheless, despite this crossover, the upward thrust has limited the chances of immediate significant falls.
Keltner Channels and Chop Zone Analysis
The pair is also brushing against the Keltner Channel’s upper limit, hinting at trader expectation of increased bullish bias. However, this potential breakout requires validation via two successive closes beyond the current band.
The Chop Zone, a recognized volatility indicator, has been recording neutral signals, which emphasizes the prospective breakout stance. However, market participants would also be keenly monitoring the uncertainty usually associated with the aforementioned congestion areas.
Concluding Multiple Time Frame Analysis
A comprehensive review of the weekly time frame emphasizes the bullish tendency awaiting further validation with the manageable hurdle of price sustainability above the resistance level.
Conclusion
Cautiously optimistic is the cue derived from the current situation. The presence of the bullish engulfing pattern, an uptrend indication coupled with the potential for a breakout, confirms this sentiment. Nevertheless, considering market indicators, there’s a possibility of a modest retraction due to imminent overbought conditions.
In analyzing the 1-week, 1-day, and 4-hour time frames, the trends indicate:
- The 1-week trend remains bullish, emphasizing strong upward momentum supported by market sentiment.
- The 1-day trend shows signs of a corrective phase, suggesting potential retractions are likely before further movement.
- The 4-hour trend reflects volatility with intermittent pullbacks, although the bullish outlook persists overall.
From this analysis, traders should identify potential entry points at the 1-hour time frame based on the application of all indicators and tools above. The Buy entry point can be placed at 1.0930, with a Take Profit point at 1.0990 and a Stop Loss point at 1.0910. Conversely, the Sell entry point could be positioned at 1.0910, with a Take Profit point at 1.0830 and a Stop Loss point at 1.0935.
Considering the current assessments and analysis, the Buy scenario appears to be more likely due to the prevailing bullish sentiment backed by candlestick patterns, but caution must be exercised due to nearing overbought conditions.