USD/CAD: Continuation of Bearish Trend Despite Oversold Conditions? – 03/04/2025
Tháng 4 2, 2025
Bullish Engulfing Fuels Rally: A Comprehensive EUR/USD Technical Analysis – 03/04/2025
Tháng 4 2, 2025Market Overview
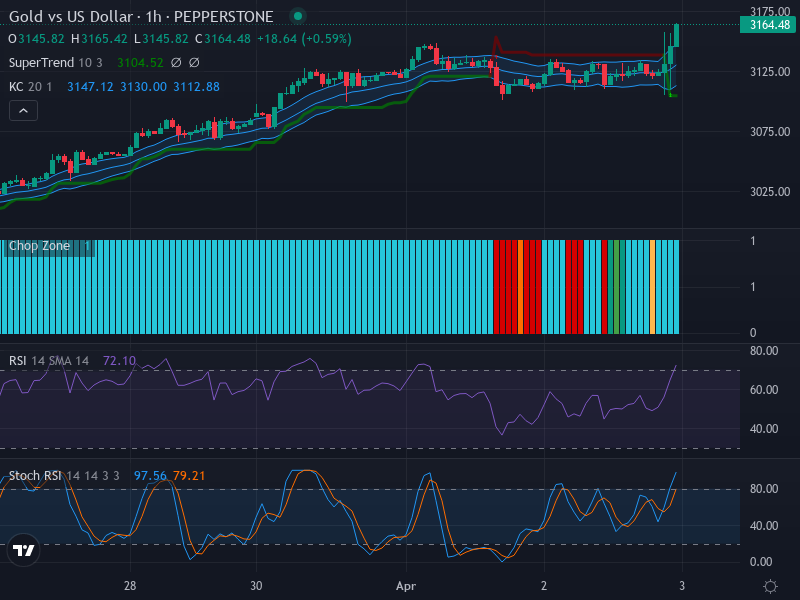
The foreign exchange market has been experiencing an upward trend in the strength of gold versus the US Dollar. This trend is confirmed by the increasing highs and lows reflected in recent candlestick patterns. The larger green candlesticks representing closed trading sessions indicate a strong bullish pressure. However, this momentum might be counterbalanced by the market’s overbought condition.
Technical Analysis
On the 1-hour chart, candlestick patterns have shown a robust bullish momentum, marked by significant green candlesticks that indicate persistent upward pressure. One of the notable zones identified in the technical analysis indicates a possible resistance near the 3175 level, primarily based on previous price reactions. Additionally, there’s a key support level around the 3147 region that may play a critical role during a potential price retracement.
The Relative Strength Index (RSI) currently stands at 72.10, signaling that the market has entered overbought territory. While this supports the prevailing bullish momentum, it also indicates that traders should proceed with caution as the market seems overstretched and may soon experience a price pullback.
Similarly, the Stochastic RSI provides a near-identical picture. The K line is at 97.56, surpassing the D line at 79.21, thereby confirming ongoing bullish momentum. However, the overbought status of both indicators suggests a possible market reversal could be ahead.
Further insights can be gleaned from the Keltner Channels and the Chop Zone, which reveal significant information about the price trend and market volatility. With the price positioned above the middle band of the EMA 20, the chart sustains the perspective of an upward trajectory. Nevertheless, the widening channels indicate increased market volatility. Notably, the Chop Zone bars have turned teal, signaling an uptick in bullish strength.
Conclusion and Trading Recommendations
Given the bullish momentum reflected by the increasing highs and lows depicted on the candlestick patterns, the current trend appears to favor buyers. Yet, the overbought conditions highlighted by both the RSI and Stochastic RSI cannot be ignored, as these often foreshadow market reversals. Consequently, buyers should exercise caution and set protective stop loss levels to guard against sudden price pullbacks.
In light of the analysis conducted over multiple time frames, here are key observations:
- 1-Week Time Frame: The overall trend remains bullish, supported by increasing momentum indicators.
- 1-Day Time Frame: The market shows strong upward pressure, though caution is warranted due to potential overbought conditions.
- 4-Hour Time Frame: Recent price movements indicate bullish sentiment, but the risk of retracement necessitates attention to resistance levels.
Now, turning our attention to potential entry points within the 1-hour time frame, we can outline specific strategies:
- Buy Entry Point: 3150, Take Profit Point: 3190, Stop Loss Point: 3140.
- Sell Entry Point: 3175, Take Profit Point: 3150, Stop Loss Point: 3185.
Based on the ongoing analysis, a Buy scenario appears more likely, given the current bullish momentum. However, traders should remain vigilant to swift market changes and adapt their strategies accordingly.