Navigating Market Volatility: An In-Depth Study of AUD/USD in Uncertain Times – 03/04/2025
Tháng 4 2, 2025
Gold vs. US Dollar: Bullish Momentum Faces Overbought Conditions – 03/04/2025
Tháng 4 2, 2025Market Overview
The currency pair of the US Dollar versus the Canadian Dollar (USD/CAD) has witnessed significant fluctuations lately. Recent technical indicators and chart analyses indicate that the USD/CAD is currently entrenched in a bearish trend, suggesting a continuation of the downward movement. This bearish momentum is accompanied by increased volatility, creating an intensive trading environment for this pair. Even though the Relative Strength Index (RSI) indicates an oversold condition, the market appears to be leaning towards further potential downward movement.
Technical Analysis
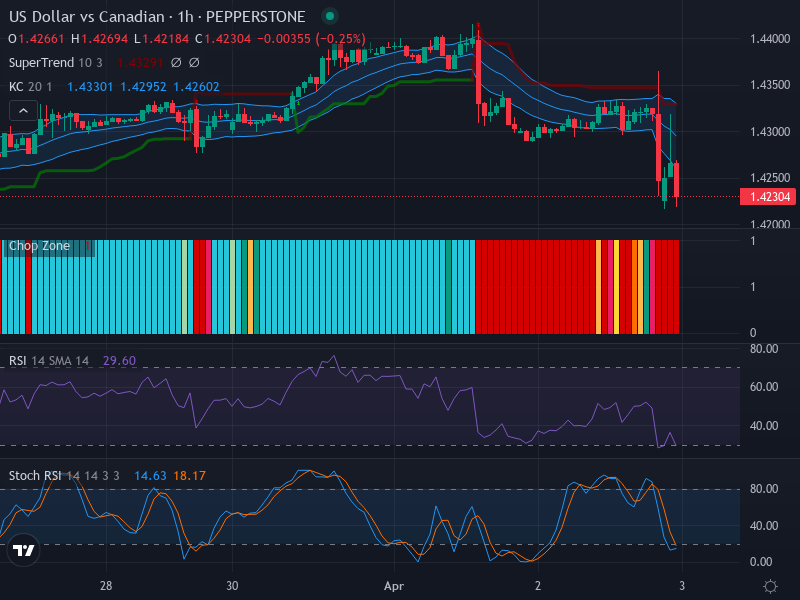
A close examination of candlestick patterns reveals a strong bearish tendency. The price trend has penetrated the lower band of the Keltner Channel, signaling heightened bearish momentum. The analysis points toward an ongoing downward movement, with potential for further decline, especially if critical support levels, particularly around the 1.4210 area, are breached.
Currently, the Relative Strength Index (RSI) sits at approximately 29.60, indicating a clear oversold condition. Typically, such levels might hint at a potential bullish reversal. However, in light of the prevailing bearish environment, a temporary bullish retracement seems more likely rather than a full-fledged trend reversal. Moreover, the absence of significant divergence affirms the continued bearish trend.
The analysis of Keltner Channels and Chop Zone reveals that the price remains below the middle band, further endorsing the bearish sentiment. With the channels moderately expanding, traders are encouraged to be vigilant regarding the increased market volatility. The Chop Zone analysis supports this bearish outlook, with predominantly red bars reflecting a sustained bearish environment. The occurrence of two consecutive breaches below the Keltner Channel bands suggests the potential continuation of this breakout.
In analyzing the Stochastic RSI, the ‘K’ line value is recorded at 14.63. Although the complete picture requires the ‘D’ line value, which is not included in the current data, the existing indications reinforce the prevailing bearish sentiment.
Conclusion and Trading Recommendations
Based on the comprehensive technical analysis of the USD/CAD currency pair, it is evident that the market strongly indicates a continued bearish trend for the short term. Traders may want to embrace this downward wave while remaining vigilant about the oversold RSI signal that suggests a possible, albeit temporary, price retracement.
Cautious traders should consider waiting for additional bearish confirmations before entering positions. In contrast, aggressive traders could contemplate entering short positions while closely monitoring the critical support levels around 1.4210 for any potential bullish rebounds.
1-Week Trend: The analysis indicates a sustained bearish trend, with consistent lower lows being established.
1-Day Trend: The market displays signs of potential continuation in the downward movement as support levels are being tested.
4-Hour Trend: Short-term bearish momentum is confirmed as price actions gravitate below the Keltner Channel middle band.
For potential entry points, aggressive traders might consider the following:
- Buy Entry Point: 1.4230, Take Profit Point: 1.4260, Stop Loss Point: 1.4200
- Sell Entry Point: 1.4200, Take Profit Point: 1.4150, Stop Loss Point: 1.4230
Given the current analysis, a Sell scenario appears more likely as the prevailing market sentiment adheres more strongly to bearish trends.
Risk Disclaimer
Forex trading involves substantial risks, including the possibility of losing the entire invested amount. This analysis represents the viewpoint of the financial analyst and does not necessarily predict future market conditions. Always conduct thorough research before engaging in any trades based on technical analysis data.