The Downtrends and Potential Short-Term Reversal: A Technical Analysis of the USD/CHF Forex Pair – 03/04/2025
Tháng 4 2, 2025
NZD/USD Technical Analysis – Possible Shift Towards an Upward Momentum – 03/04/2025
Tháng 4 2, 2025Market Overview
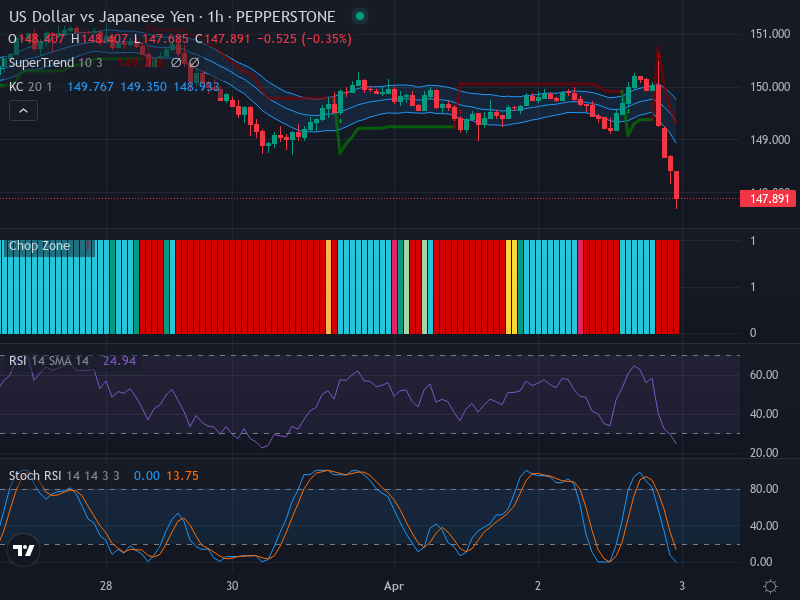
The US Dollar/Japanese Yen (USD/JPY) forex pair has been undergoing a consistent downward trajectory, marked by a series of bearish candlesticks. This setup indicates substantial bearish momentum, which might lead to further depreciation of the pair. Price volatility is also high, evidenced by the expansion of the Keltner Channels. The currency pair appears to have found comfort in a predominantly bearish posture over both highly scrutinized 1-week and 1-day time frames.
Technical Analysis
The robust downward trend is clearly reflected through several technical indicators. The Relative Strength Index (RSI), currently registering at 24.94, is signaling ‘oversold’ conditions, further affirming the ongoing bearish momentum. Importantly, there is no discernible divergence between the RSI and the price movement, consolidating the bearish outlook.
An investigation of Keltner Channels and the chop zone offers deeper insights. An evident sideway market pattern previously observed in the chop zone has been superseded by a pronounced downturn marked by red bars. Concurrently, the price is currently positioned below the middle band of the Keltner Channels, reinforcing the bearish sway.
An analysis of the Stochastic RSI presents further evidence for the established bearish momentum. Specifically, the Stochastic RSI’s K value is at 0.00, and the D value at 13.75. The indication of the K line crossing below the D line provides substantiation for continued downward pressure in this pair.
Conclusion and Trading Recommendations
Overall, the persistent bearish momentum, as signaled by numerous downward indicators, suggests a short-term bearish trend for USD/JPY. Traders might want to consider potential short selling opportunities or wait for a retracement to the Keltner Channels midline, which could act as a buy opportunity in case a price reversal occurs.
However, it’s crucial to monitor the dynamics of accompanying indicators, particularly the RSI’s oversold readings. Any hint of bullish divergence, which may emerge from the interplay of the RSI and price action, could suggest potential upturns.
1-Week Trend: The downward trajectory remains strong with no indication of reversal.
1-Day Trend: Continued selling pressure with bearish candlestick formations.
4-Hour Trend: Slight consolidation but still predominantly bearish.
After analyzing these time frames, potential entry points based on a 1-hour analysis suggest:
- Buy Entry Point: 132.00; Take Profit Point: 133.00; Stop Loss Point: 131.50.
- Sell Entry Point: 131.50; Take Profit Point: 130.50; Stop Loss Point: 132.00.
Given the current downtrend and high levels of bearish momentum observed across multiple indicators, a Sell scenario appears more likely than a Buy scenario at this time.