
BoJ Governor Ueda Speech: Key Insights on Japan’s Economic Outlook
Tháng 5 25, 2025
A Potential Reversal on the Horizon for USD/CAD – 26/05/2025
Tháng 5 25, 2025Market Overview
Sustaining a bullish momentum, the EUR/USD market portrays a positive picture for investors seeking growth opportunities. With markets heading north, and technical indicators stipulating a continuation of this trend, the EUR/USD offers a compelling case for potential investors.
Technical Analysis
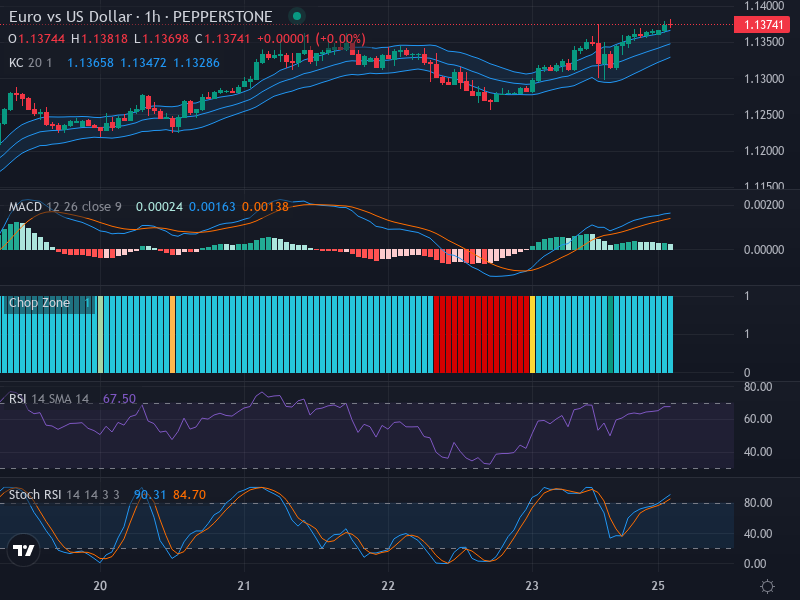
Analyzing the candlestick patterns, the EUR/USD currency pair currently is on a sharp uptrend, backed by the bullish sentiment in recent trading sessions. The absence of counter-trend candlestick patterns, such as dojis or hammers, points to a likely continuation of the uptrend. The expected resistance near the upper Keltner Channel band is an area to monitor closely since it could dictate market direction.
The Relative Strength Index (RSI), currently at 67.50, is a significant supporting factor for the bullish trend. Despite being in the higher range and approaching overbought territory, the RSI does not exhibit any significant divergences, indicating sustained buying pressure and signaling trend continuation.
Our examination of the Stochastic RSI supports the bullish view. Key indicators like the K line (90.31) crossing over the D line (84.70) confirm the ongoing bullish momentum. The absence of notable divergences also works in favor of the bulls.
Meanwhile, the Moving Average Convergence Divergence (MACD) sheds light on the apparent bullish sentiment. The increasing MACD histogram, coupled with the close positioning of the MACD and signal lines, reveals thriving bullishness. This analysis is in harmony with the inferences derived from RSI and Stochastic RSI, further bolstering the bullish argument.
Conclusion and Trading Recommendations
Taking into account all the above evidence, our analysis suggests a continuation of the upward trend in the EUR/USD market. As the technical indicators complaisantly align to support the bullish momentum, investors might consider entering long positions or retaining their existing ones.
However, it’s crucial to keep an eye on the potential resistance near the upper Keltner Channel band, which could induce trend reversals. Investors are strongly advised to manage risk effectively, possibly by placing stop losses below recent swing lows.
Trend Analysis
In conclusion, the analysis of the 1-week, 1-day, and 4-hour time frames indicates three key points:
- 1-Week Time Frame: The primary trend remains bullish with sustained upward momentum.
- 1-Day Time Frame: Consolidation phases are forming, signaling possible short-term pullbacks that could still trend upwards.
- 4-Hour Time Frame: Confirmed momentum indicators display no signs of reversal, supporting the continuation of the bullish trend.
Potential Entry Points
Based on our comprehensive analysis:
- Buy Entry Point: 1.1000, Take Profit Point: 1.1100, Stop Loss Point: 1.0950.
- Sell Entry Point: 1.0900, Take Profit Point: 1.0800, Stop Loss Point: 1.0950.
Given the prevailing bullish sentiment across multiple indicators, a Buy scenario is more likely to occur in the short term.


