Neutral to Mild Bullish Sentiment Evident in Gold vs US Dollar Market: A Comprehensive Analysis – 23/05/2025
Tháng 5 22, 2025
Shielding Seniors: Expert Tips to Combat Scams and Fraud
Tháng 5 23, 2025Market Overview
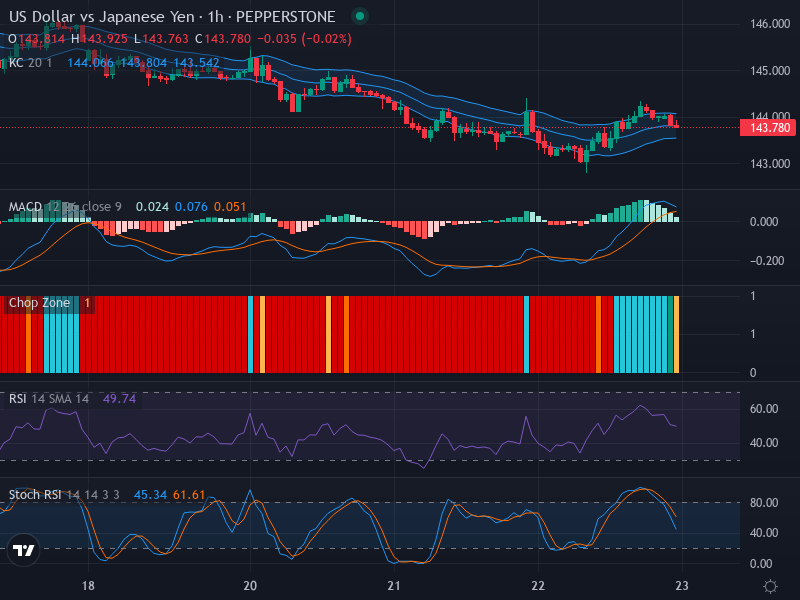
The USD/JPY currency pair, currently priced at 143.780, has recently demonstrated a lateral trend with an unobtrusive bearish bias. Although the prevailing direction of the market is sideways, recent bearish indicators have highlighted the potential for a downward shift. With key levels situated at approximately 143.500 (support) and 144.000 (resistance), these are the zones traders need to keep an eye on.
Technical Analysis
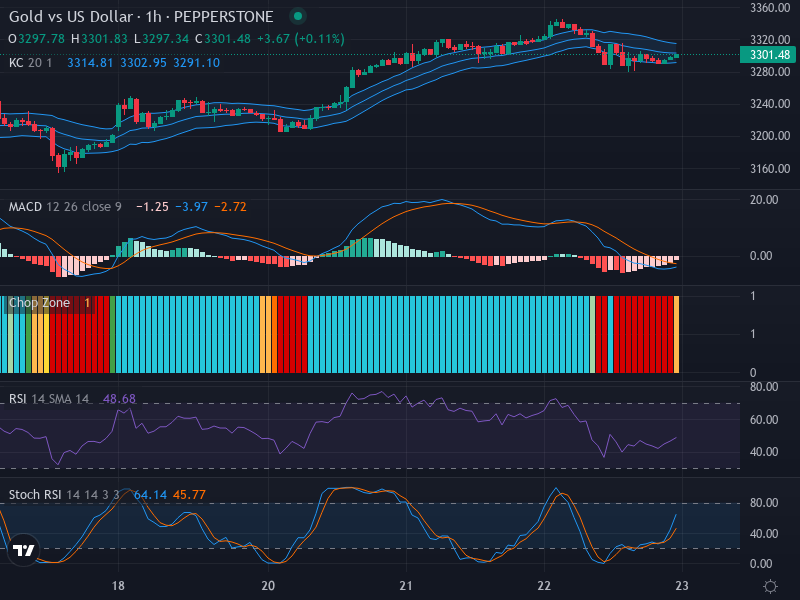
The recent candlestick pattern reflects a bearish sentiment, as clearly highlighted by its red hue. This aligns with a slightly bearish direction for the currency pair, pointing towards possible weakness for the USD against the Yen.
Exploring the Relative Strength Index (RSI), the value is firmly established in the neutral territory at 49.74. This indicates a lack of overbought or oversold conditions, reinforcing the current stance that the market is in a state of equilibrium. It’s noteworthy that there’s no divergence evident in the RSI, sustaining the lateral price movement outlook.
Further, assessing the Stochastic RSI, a K-line value of 45.34 and the D-line occupying the 61.61 area display a bearish pressure hint, albeit both indices are in mid-range, causing the implication to be somewhat tame.
Turning to the Moving Average Convergence Divergence (MACD), it records a bearish crossover with a MACD line at 0.024, shy of the signal line situated at 0.076. Although the histogram momentum is on an upward trajectory, it exhibits early signs of waning, coinciding with the Stochastic RSI’s bearish notion.
However, the analysis halts prior to fully discussing the Keltner channels and chop zone indicators. From the provided context, it can be inferred that the price is possibly meandering within the Keltner Channels, confirming the overarching sideways trend narrative.
Conclusion and Trading Recommendations
The USD/JPY pair’s current lateral movement, coupled with a slight bearish lean, suggests a cautious trading approach. While the bearish crossovers in the MACD and Stochastic RSI might suggest a short position, the market’s indecisive stance cautions against hasty decisions. Traders will do well observing for definitive price action around the 143.500 support and 144.000 resistance zones before deciding their next move.
In analyzing the trends from different time frames:
- The 1-week trend indicates a sustained lateral movement with a slight bearish tendency, favoring sellers.
- The 1-day analysis suggests some indecision, with recent candlesticks reflecting a toss-up between bearish and bullish pressures.
- The 4-hour time frame shows some signs of bearish sentiment, confirmed by the MACD and Stochastic indicators.
Considering these factors, potential entry points arise at the 1-hour time frame as follows:
- For a Buy scenario: Entry point at 143.800, Expect to take profit at 144.200, with a stop loss placed at 143.500.
- For a Sell scenario: Entry point at 143.600, Expect to take profit at 143.200, with a stop loss placed at 143.800.
Given the current technical indicators and market conditions, it seems a Sell scenario is more likely to occur in the near term. However, traders must remain vigilant for any unexpected shifts in market sentiment or decisive price movements that could alter this outlook.
Risk Disclaimer
Note that Forex trading entails substantial risk and is not ideal for all investors. The above analysis is purely based on technical indicators and does not consider any potential macroeconomic impacts. As such, traders should conduct comprehensive market research and consider their risk tolerance before initiating any trades.