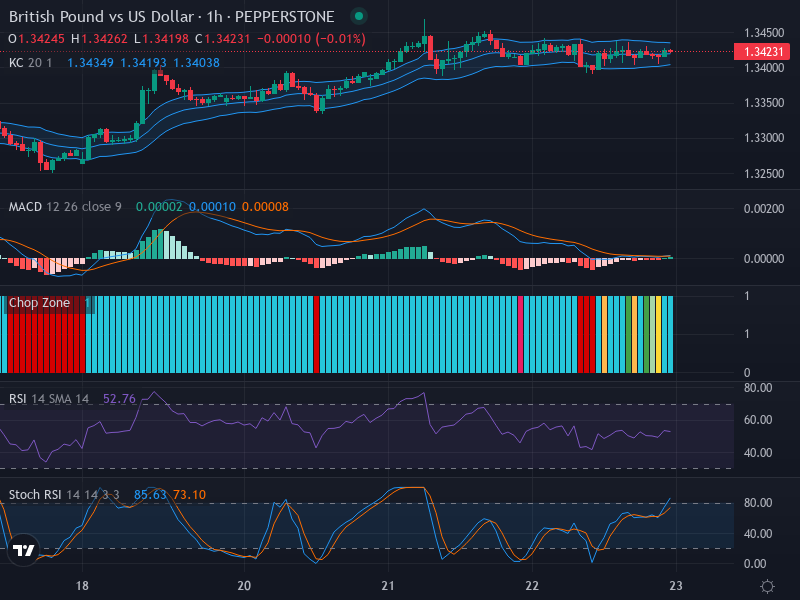
GBP/USD Pair: Tides of Uncertain Market Sentiment – 23/05/2025
Tháng 5 22, 2025
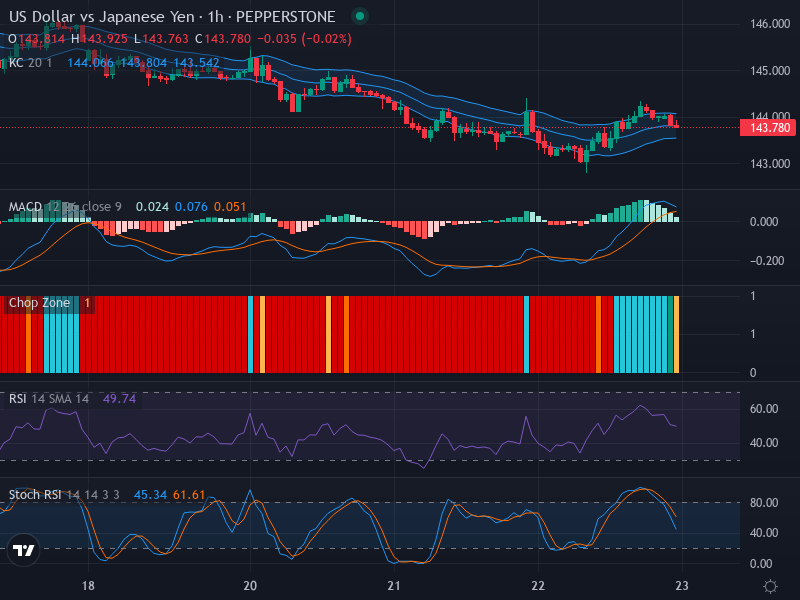
Navigating the Lateral Promenade: An In-depth Technical Analysis of USD/JPY – 23/05/2025
Tháng 5 22, 2025Market Overview
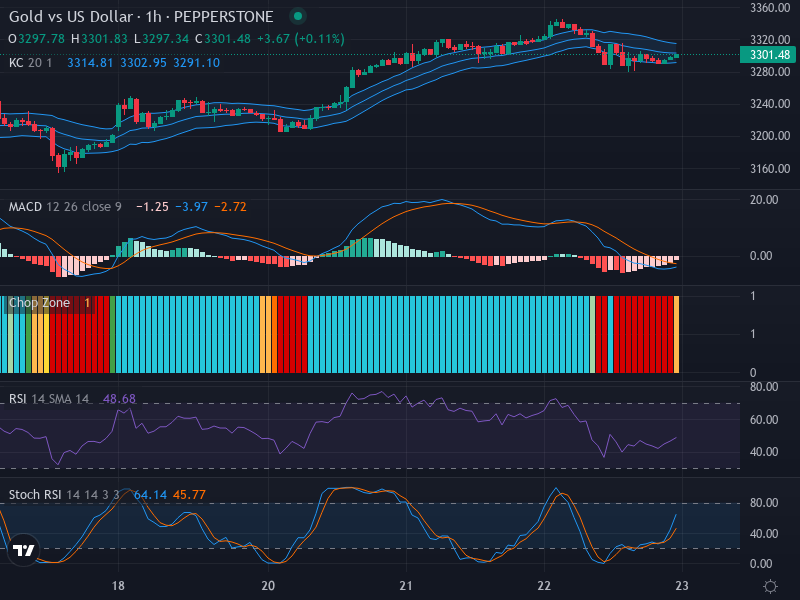
The Forex market pairing of Gold vs. US Dollar (XAU/USD) has taken a neutral to slightly upward trajectory in recent trade hours, offering potential opportunities for savvy investors. As of the latest evaluation, the Gold price stands at 3301.48, hinting at an increasingly active market where every participant is bracing for the next significant move.
Technical Analysis
A careful examination of the latest candlestick data fails to identify any major patterns that clearly signal a market reversal or continuation. However, a slight upward trajectory in recent candlestick action sets the market direction leaning towards bullishness.
Support and resistance levels are prominent factors in the current picture of the XAU/USD pair. The key support level is around the 3280 mark, calculated based on previous lows. Conversely, resistance has emerged near the 3320 level, derived from recent market highs. These zones might become significant turning points for future price actions.
The Relative Strength Index (RSI), currently reading at 48.68, also echoes neutrality with a skew towards bullishness as it revolves around the 50-mark. This non-divergent line aids in supporting the overall neutral-to-bullish trend perception at present.
Cross-examining this with the Stochastic RSI (Stoch RSI), we notice a K line value of 64.14 crossing above the D line value of 45.77. This crossover insinuates potential upward momentum, supporting a slight bullish sentiment in the short term.
The Moving Average Convergence Divergence (MACD), however, presents an interesting juxtaposition to other indicators. A bearish crossover is recently witnessed with the MACD line (-3.97) situated below the signal line (-2.72). Falling histogram bars further allude to a bearish undertone, which counterweighs the short-term bullish indicators.
Conclusion and Trading Recommendations
The analysis reveals a complicated landscape, laden with conflicting signals. A bullish inclination signaled by the RSI and Stoch RSI competes with the bearish undertone suggested by the MACD. In this light, traders might want to exercise a strategic approach.
Investors could adopt a wait-and-see attitude until a clearer market direction emerges. However, for those who enjoy the adventurous side of trading, short-term bullish positions might be worth considering, with a vigilant eye set on the aforementioned support and resistance levels.
In examining the different time frames:
- 1-Week Time Frame: The overall trend is slightly bullish, reflecting a gradual upward movement with room for potential gains.
- 1-Day Time Frame: The market shows signs of consolidation, indicating indecision among traders that could precede a stronger move.
- 4-Hour Time Frame: Price action reveals a minor uptick, reinforcing a mild bullish sentiment, though caution is advised due to potential reversals.
Based on this analysis, potential entry points include the following:
- Buy Entry Point: 3305, Take Profit Point: 3325, Stop Loss Point: 3280.
- Sell Entry Point: 3290, Take Profit Point: 3270, Stop Loss Point: 3305.
Given the current indicators, a Buy scenario appears slightly more favorable, though traders should remain vigilant due to the conflicting signals present in this analysis.
Risk Disclaimer
This analysis is only for informational purposes and should not be considered investment advice. Forex trading involves significant risk, including the potential for loss of the entire capital. Investors should thoroughly research and consider their financial situation and risk tolerance before making investment decisions.