EUR/USD: A Comprehensive Technical Analysis Amid Bearish Momentum – 23/05/2025
Tháng 5 22, 2025
Neutral to Mild Bullish Sentiment Evident in Gold vs US Dollar Market: A Comprehensive Analysis – 23/05/2025
Tháng 5 22, 2025Market Overview
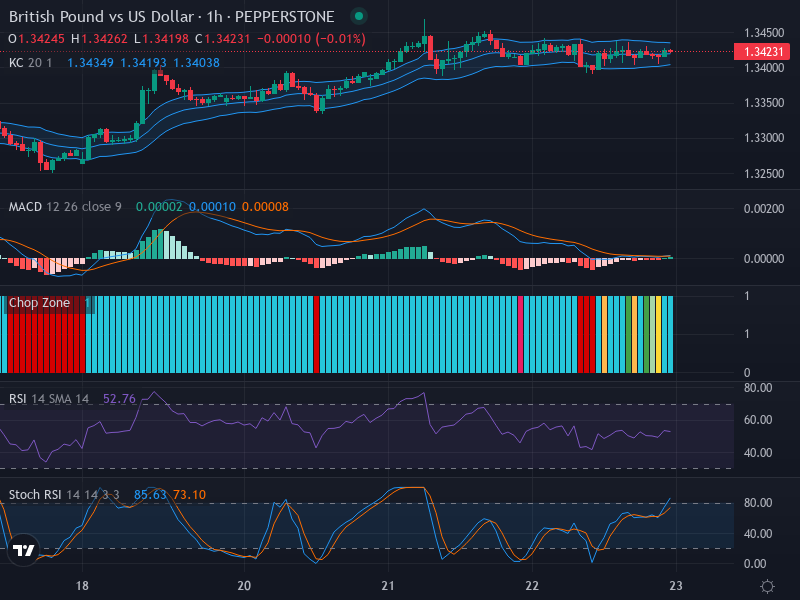
The foreign exchange market has seen relative neutrality in the trading of the British Pound vs. US Dollar (GBP/USD). Currently pegged at a price of 1.3421, the pair has been exhibiting lateral movement with price fluctuations staying within a narrow band. This suggests that the market sentiment is more or less undecided, leading to a possible consolidation phase.
Technical Analysis
Analysis of candlestick patterns over the past trading sessions does not unearth any significant formations potent enough to suggest strong trend reversals. This adds further to the observation that the market sentiment continues to be indecisive.
A look at the Relative Strength Index (RSI) offers a similar narrative, with an RSI value of 52.76 indicating balanced buying and selling pressures. Consequently, the market positioning stays neutral, without showing any clear divergence.
Examining the Stochastic RSI offers a somewhat contrasting view. With a K Line at 85.63 and a D Line at 73.10, the condition borders onto overbought territory. While this could suggest a potential short-term price decrease, the absence of evident divergence means we need to look closely at other indicators.
The Moving Average Convergence Divergence (MACD) shows the MACD line slightly surpassing the signal line, suggesting the presence of subtle bullish pressure. However, a relatively flat histogram further highlights the lack of strong momentum in the market, thereby lacking key divergence or convergence signals.
The Keltner Channels and Chop Zone indicators confirm this sentiment. The price lingers near the middle band, pointing towards balanced momentum coupled with moderate volatility. The Chop Zone reveals continuous colored bars, predominantly blue, attesting to the sideways market with minimal trend strength.
Conclusion and Trading Recommendations
In the current state of affairs, the GBP/USD pair appears to be in a holding pattern with the market awaiting potent signals to define a clear trend direction. With various contradictions in different indicators, it is crucial to exercise caution. Long-term traders should consider waiting for demonstrable breakouts or breakdowns from the current price levels to confirm any substantial trend before initiating positions.
1-Week, 1-Day, and 4-Hour Trend Analysis
Given the observations from the 1-week, 1-day, and 4-hour time frames, we can summarize the trends as follows:
In the 1-week time frame, the market shows neutrality with a slight bias towards consolidation as momentum indicators are flat.
In the 1-day time frame, the indicators present mixed signals, reinforcing the lack of a clear market direction.
In the 4-hour time frame, there is a subtle bullish trend but accompanied by low volatility, indicating potential for small, cautious movements.
Potential Entry Points
Upon considering the analysis of the indicators and trends, the potential entry points are as follows:
Buy Entry Point: 1.3440, Take Profit Point: 1.3500, Stop Loss Point: 1.3410.
Sell Entry Point: 1.3400, Take Profit Point: 1.3350, Stop Loss Point: 1.3430.
Based on this analysis, the current market sentiment leans towards a Buy scenario as it exhibits slight bullish pressure, despite the overall caution advised due to mixed signals from various indicators.