EUR/USD Exhibits Bullish Momentum: Technical Insights & Trade Suggestions – 21/05/2025
Tháng 5 20, 2025
GOP’s Bold Move: Raising SALT Deduction Cap to $40,000
Tháng 5 21, 2025Market Overview:
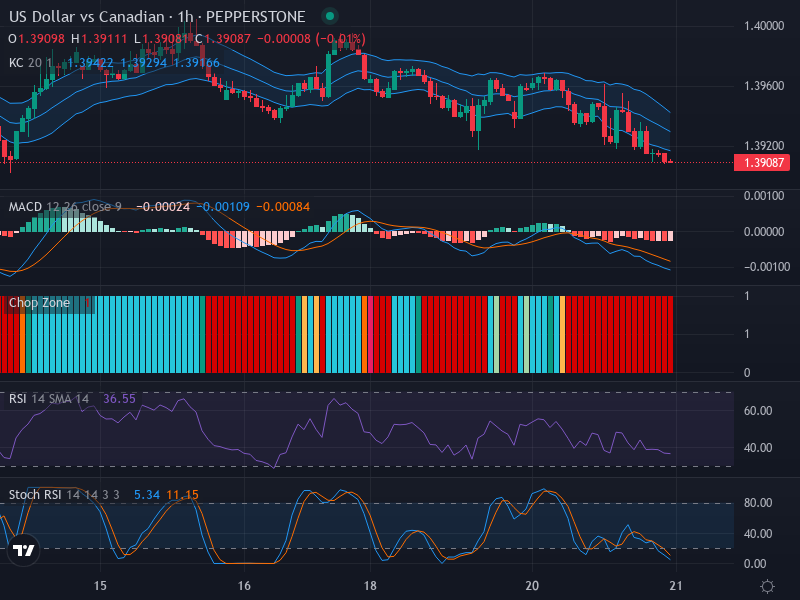
The USD/CAD currency pair’s current trend points towards bearish domination. Falling under the price level of 1.39087, the pair exhibits a continuous downward trajectory with little to no indication of a reversal. As traders grapple with these conditions, we attempt to provide clarity through a detailed examination of patterns and indicators.
Technical Analysis:
The prevailing bearish trend, as denoted by the candlestick patterns, is evident. There’s a distinct absence of any bullish reversal indications such as bullish engulfing or hammer formations. The broader market outlook mirrors this, setting up an overall bearish narrative. Yet, participants shouldn’t overlook the potential for a price retracement if the lower band of the Keltner Channels, around 1.39166, comes into play.
Turning our analysis towards the Relative Strength Index (RSI), we note a reading of 36.55, edging towards oversold territory. Still, while this suggests a slight weakening in the bearish momentum, it predominantly reinforces the ongoing downward trend. The price and RSI appear to be moving harmoniously without any significant divergences.
The Stochastic RSI presents an equally bearish view. With the K Line (5.34) below the D Line (11.15), traders are led to believe there’s ongoing downward pressure. The lack of any noticeable crossovers enriches the bearish narrative further.
The price is discerningly close to the lower band of the Keltner Channels, suggesting a potential support level. This is complemented by the Chop Zone’s bold red bars, signaling a dominant trend coupled with heightened volatility. All indicators but point towards the bearish trend’s persistence unless a discernible divergence or breakout surfaces.
Moving Average Convergence Divergence (MACD) maintains the narrative, with its line (-0.00024) lower than the Signal Line (-0.00084). Furthermore, the red, declining histogram bars further underpin the downside momentum.
Conclusion and Trading Recommendations:
The in-depth technical dissection paints an overall bearish picture for the USD/CAD pair. Traders looking to potentially hedge or profit from this scenario might consider selling positions or buying put options. While some indicators hint towards a possible short-term retracement via a support level test, the broader bearish trend seems to have an unmistakable grasp.
Market Trend Analysis:
The trend analysis identifies key points on different time frames:
- 1-week: The bearish trend appears strong with consistent lower lows and lower highs.
- 1-day: The daily charts reflect ongoing bearish momentum, confirmed by moving averages.
- 4-hour: A slight retracement may be in sight, but it is still under overall bearish pressure.
In aligning the analysis across these time frames, potential entry points can be drawn in the 1-hour time frame. Traders may consider:
- Buy Entry Point: 1.39180, Take Profit Point: 1.39310, Stop Loss Point: 1.39000.
- Sell Entry Point: 1.39050, Take Profit Point: 1.38850, Stop Loss Point: 1.39150.
Given the current market dynamics and indicators, a Sell scenario appears far more likely to materialize in the immediate future. Traders need to remain vigilant, adapting their strategies as market conditions fluctuate.