EUR/USD Forecast: Mild Bullish Trend Offset by Bearish Indicators – An In-depth Forex Analysis – 20/05/2025
Tháng 5 19, 2025
USD/JPY Forex Market: Preparing for Short-Term Upturn amid Mild Bearish Pressure – 20/05/2025
Tháng 5 19, 2025Market Overview
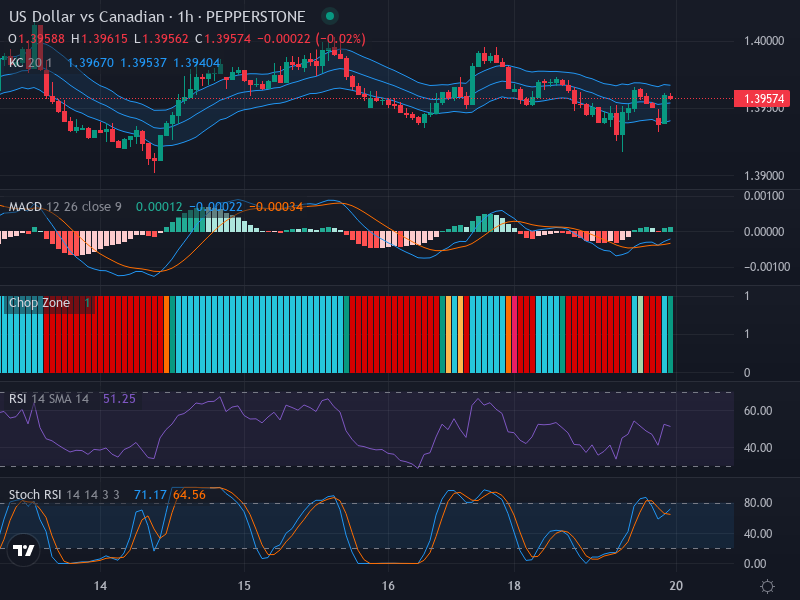
In the constantly evolving world of Forex markets, the pair of US Dollar and Canadian Dollar (USD/CAD), currently trading at 1.39574, holds a position of intrigue for traders. As indicated by the most recent candles forming on the 1H chart, the current market stands in a state of indecision, showing signs of potential reversal. At present, the chart lacks a prominent bullish or bearish trend pattern, presenting a somewhat lateral market activity.
Technical Analysis
Candlestick patterns show a small real body, suggesting the possibility of a future shift in market dynamics. This implies a potential reversal could be in the offing. The ensemble of recent candle formations is signaling the market’s current withstanding of a decisive direction. Traders should keep an eye on the looming resistance level at 1.39670 as a possible crucial point of retracement.
Underlying the chart’s neutral behavior, the Relative Strength Index (RSI) currently stands at a balanced point of 51.25. This also points to a lack of strong momentum, reinforcing the sideline movement echoing from the price action. Moreover, the Stochastic RSI indicates a slight overbought condition, with ‘K Line’ at 71.17 and ‘D Line’ at 64.56, signaling the possibility of a minor pullback.
In the MACD Analysis, the MACD Line at 0.00012 and the Signal Line at 0.00022 are reflecting a bearish bias with negative histogram momentum. This further consolidates the ominous suggestion of continuation of the prevalent sideways to slight bearish dynamics.
Finally, the Keltner Channels and the Chop Zone reveal similar patterns. The price is hugging the mid-band, demonstrating a lack of clear breakout. An indication of low volatility is also discerned as the channels are not expanding significantly. The Chop Zone exhibits mixed red/blue bars, verifying the extended phase of sideways movement.
Conclusion and Trading Recommendations
As a nutshell of the present chart analysis, the USD/CAD currency pair echoes a sideways pattern with the potential for a bearish bias. Possible retracement near the 1.39670 resistance level could be the game-changer.
For traders, waiting for further confirmation can turn out to be a prudent strategy. Wait for any signs that might indicate an upcoming exit from the lateral market, primarily focusing on a break from the resistance threshold. Confirmations from MACD and RSI should also be factored into the final decision.
Trend Analysis by Time Frame
In analyzing the 1-week, 1-day, and 4-hour time frames, the trends embody the following:
- The 1-week trend showcases a potential bearish reversal pattern forming, indicating a longer-term downward trajectory.
- The 1-day trend demonstrates ongoing lateral movement but hints at exhaustion in buying pressure.
- The 4-hour trend suggests tightening price action within a range, further confirming indecisiveness.
Upon evaluating the indicators and tools above, here are the final trading recommendations based on the 1-hour time frame:
- Buy Entry Point: 1.39550, Take Profit Point: 1.39750, Stop Loss Point: 1.39450.
- Sell Entry Point: 1.39670, Take Profit Point: 1.39500, Stop Loss Point: 1.39750.
In conclusion, a Sell scenario appears more likely if the price approaches the resistance level and shows signs of rejection. Conversely, a decisive breakout above 1.39750 may redefine the scenario to a buy opportunity. Traders should remain vigilant and responsive to the evolving market dynamics.