Upbeat Momentum Highlighted in Gold Versus US Dollar Forex Market – 19/05/2025
Tháng 5 18, 2025EURUSD Market Prediction: Neutral Sentiment and Sideways Movement
Tháng 5 19, 2025Market Overview
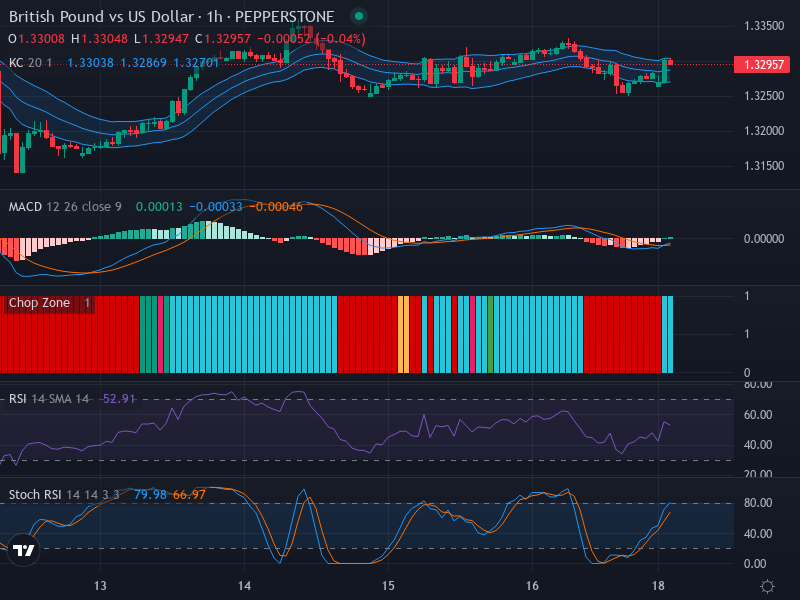
The GBP/USD forex trading pair has recently been locked in a lateral trend, with its current price sitting at 1.32957. There are no strong price signals indicating an immediate upward or downward surge, as the market maintains a mostly neutral disposition.
Technical Analysis
A look at the candlestick patterns reveals a sideways market movement. There are currently no clear patterns suggesting any major price rallies or retracements.
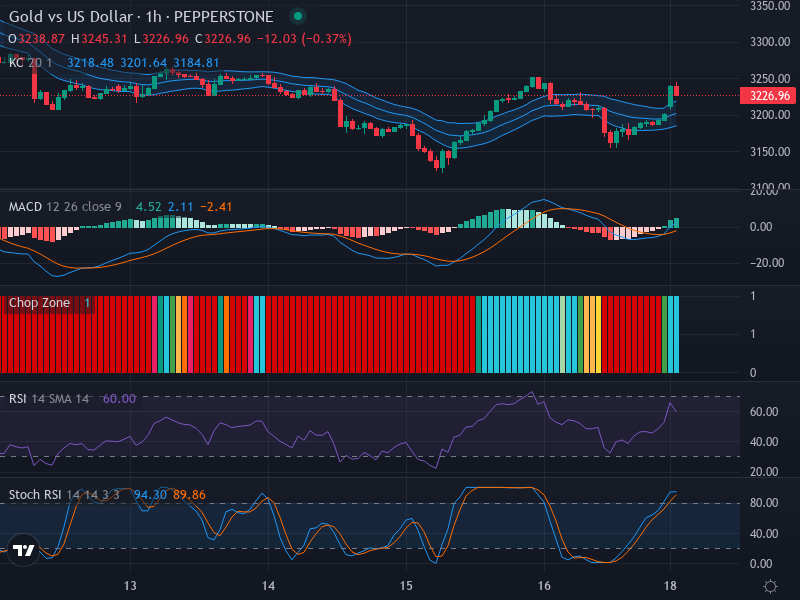
The Keltner Channels and Chop Zone show the trading pair hovering around the midpoint, indicating a lack of a pronounced long-term shift in either bullish or bearish direction. Equally, there has been no substantial widening of the channels to flag a spike in market volatility. The Chop Zone’s mixed-color display reinforces the suggestion of a currency market caught in a holding pattern.
Drilling down into the specifics, the Relative Strength Index (RSI) sits at 52.91—well within the neutral range. This supports the broader picture of a stagnant market trend. Additionally, there are no key divergences observed between the RSI’s trajectory and the price movement, further inculcating a status quo scenario.
Conversely, Stochastic RSI data indicates a different scenario. Both K and D values, at 79.98 and 66.97 respectively, are lodged in the overbought zone. Coupled with a recent K/D crossover, it might hint at the beginnings of a possible downward momentum, contradicting the neutral RSI narrative.
Moreover, the MACD (Moving Average Convergence Divergence) paints a bearish picture. A confirmed bearish crossover is in play, with the MACD line lying below the signal line. This, along with a weakening histogram momentum, might be a signpost of a potential downward shift.
Conclusion and Trading Recommendations
The mixed signals in the GBP/USD market underline the tricky nature of the current forex environment. Though prices are currently marooned in a neutral zone, the overbought Stochastic RSI and bearish MACD crossover suggests that traders might want to brace for potential volatility and lean towards defensive strategies. Clients are advised to monitor price action closely and consider a wait-and-see approach until clearer signals emerge.
Trend Analysis
Analyzing the market across different time frames gives further insight:
- The 1-week time frame indicates sideways movement, reflecting indecision among traders with no strong directional bias.
- The 1-day time frame supports the notion of stability, with price maintaining a neutral stance without drastic shifts.
- The 4-hour time frame reveals potential bearish signals, especially with the recent overbought indicators and price fluctuations suggesting a retraction in bullish enthusiasm.
Potential Entry Points
Considering the current analysis, potential entry points are as follows:
- Buy entry point: 1.3320, Take profit point: 1.3370, Stop loss point: 1.3270.
- Sell entry point: 1.3280, Take profit point: 1.3225, Stop loss point: 1.3310.
In conclusion, the likelihood of a Sell scenario appears to be stronger given the bearish signals reflected in the indicators. Therefore, traders should remain vigilant for potential downward moves, exercising caution before entering new positions.