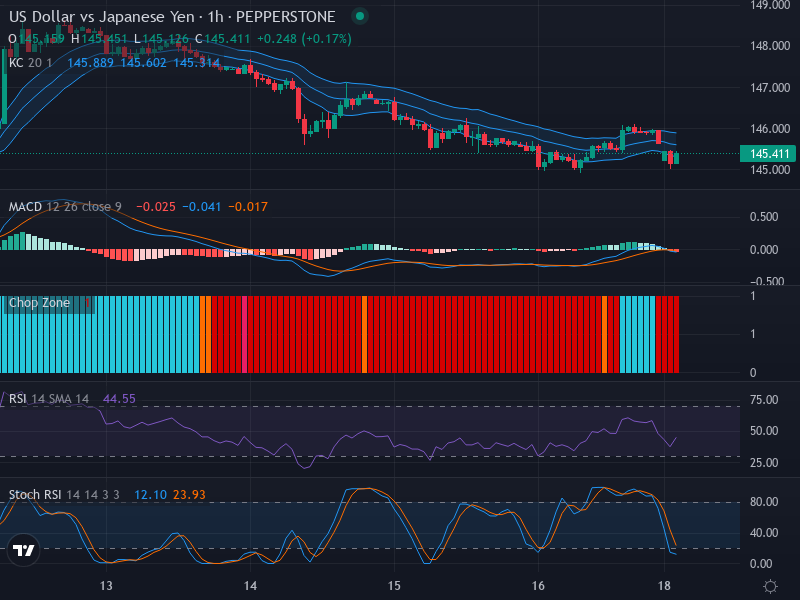
US Dollar vs. Japanese Yen: A Bearish Bias As Volatility Rises – 19/05/2025
Tháng 5 18, 2025
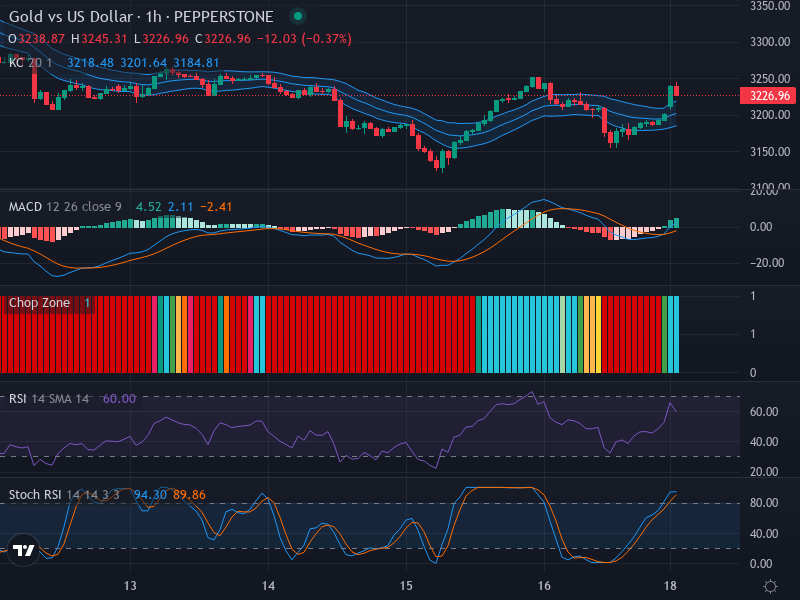
Upbeat Momentum Highlighted in Gold Versus US Dollar Forex Market – 19/05/2025
Tháng 5 18, 2025Market Overview
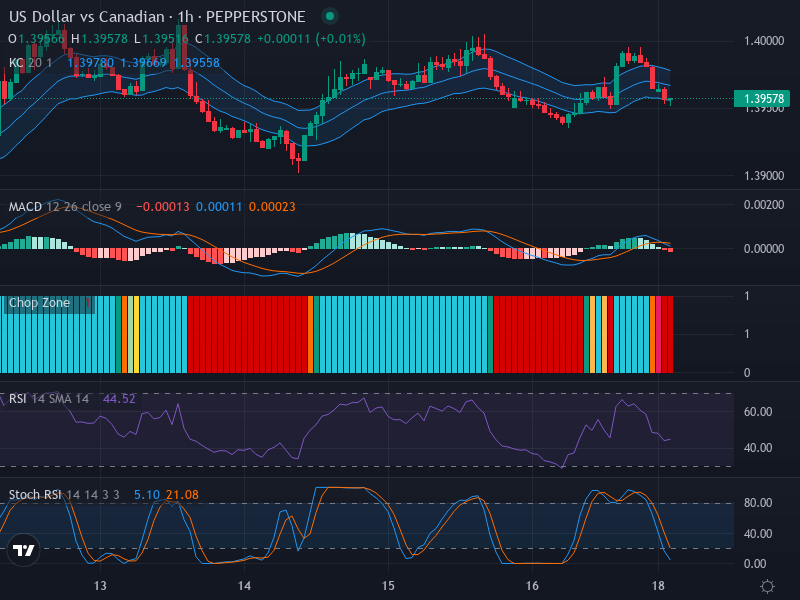
The USD/CAD currency pair, more colloquially known as the Loonie, has been exhibiting a lateral trend with minor fluctuations. This tug of war between the bulls and bears has led to a pattern characterized by small candlestick bodies with shadows, illustrating market indecision. As of now, the pair is being quoted at 1.39578.
Technical Analysis
A meticulous examination of the USD/CAD chart reveals several noteworthy technical aspects. The current price action oscillates around 1.39578, with 1.3960 (middle Keltner band) acting as potential support and 1.39780 (recent high) as a plausible resistance.
On the Relative Strength Index (RSI), the pair sits around 44.52, aptly suggesting its stay in the neutral area. No excessively overbought or oversold conditions can be discerned currently, which further adds to the narrative of extended price consolidation without definitive bullish or bearish biased directional tendency.
A closer look at the Stochastic RSI brings the K Line Value of 5.10 and D Line Value of 21.08 to light. The pair seems to dwell within an oversold zone, indicating room for potential upward momentum, particularly triggered by the possibility of an impending bullish crossover.
However, looking at the MACD analysis tempers our bullish outlook somewhat. With the MACD line (0.00011) falling below the signal line (0.00023), there is a clear bearish crossover. Regarding the histogram, its momentum seems to be declining, hinting that the previously observed bullish tendency could be losing steam.
Conclusion and Trading Recommendations
In light of the above analysis, investors should expect the USD/CAD pair to stay within its current trading range, bounded by the defined resistance and support levels, for the time being. There seems to be a possible upwards momentum, hinted by the Stochastic RSI, though investors should keep an eagle eye on the bearish crossover on the MACD.
As the market situation remains fraught with uncertainty and potential sudden shifts, it’s wise to keep Risk/Reward ratios in check, have stop-losses in place, and refrain from making large, unanticipated moves until definitive price action becomes apparent.
Technical Trend Analysis
Looking deeper into the indicators for various time frames, we see the following trends emerge:
- In the 1-week time frame, the overall trend remains lateral with no significant breakout, causing trader indecision. Expect fluctuations to continue as market participants await further economic signals.
- In the 1-day time frame, a potential bullish reversal is indicated courtesy of the Stochastic RSI’s positioning, yet the bearish pressure from MACD suggests that caution is essential.
- In the 4-hour time frame, expect movements to remain tightly bound around the support and resistance levels identified, particularly around 1.3960 and 1.39780. Price action could oscillate with minor spikes in either direction.
As we analyze the 1-hour time frame, traders may look for entry points based on these indicators:
- Buy Entry Point: 1.3965, Take Profit: 1.3990, Stop Loss: 1.3950.
- Sell Entry Point: 1.3950, Take Profit: 1.3920, Stop Loss: 1.3960.
Given the current market sentiment and mixed signals from the indicators, the Sell scenario appears to carry a higher potential due to prevailing bearish indicators despite indications of possible upsides from the Stochastic analysis. Traders should remain vigilant and adaptable as market dynamics evolve.