Forex Technical Analysis: Insights for Today (May 19, 2025) – 19/05/2025
Tháng 5 18, 2025
A Detailed Look at the Current Status and Potential Moves of the USD/CAD Forex Pair – 19/05/2025
Tháng 5 18, 2025Market Overview
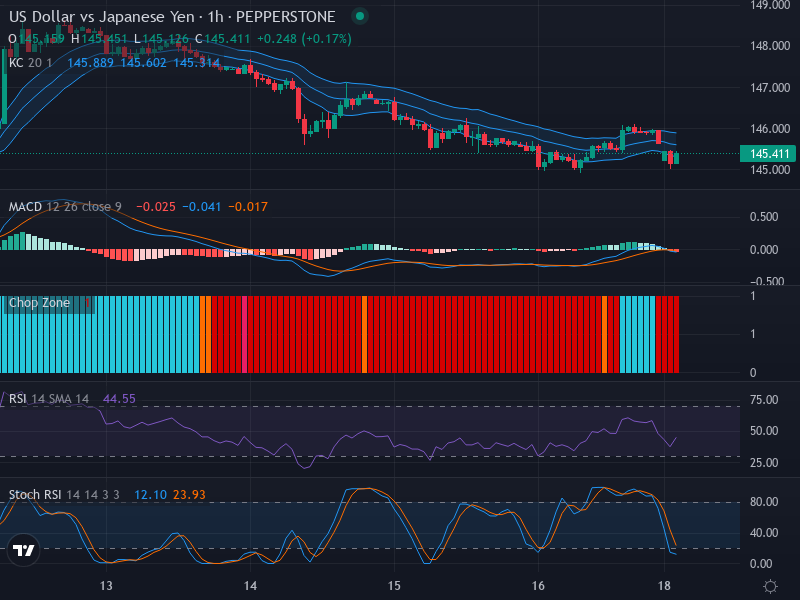
In the current foreign exchange market landscape, the US Dollar (USD) and the Japanese Yen (JPY) are trading with a pronounced downward bias, with the USD/JPY pair quoted at 145.411. The dominant trend, as evidenced by a series of bearish candlestick formations, suggests that market participants are favoring a sell-off. However, the potential for retracements presents uncertainty in the short term.
Technical Analysis
The chart patterns reflect a struggle between sellers maintaining their grip and buyers preparing for potential rebounds. The bearish predomination implies a capacity for further depreciation. However, the emergence of smaller candle bodies after several larger, downward candles indicates a potential deceleration of the downward momentum, cautioning traders about potential price retracements.
In terms of chart boundaries, a critical strategic place to watch is the resistance at 145.600. As this level coincides with the medium line of the Keltner Channel, a break above could suggest a shift in the bearish sentiment.
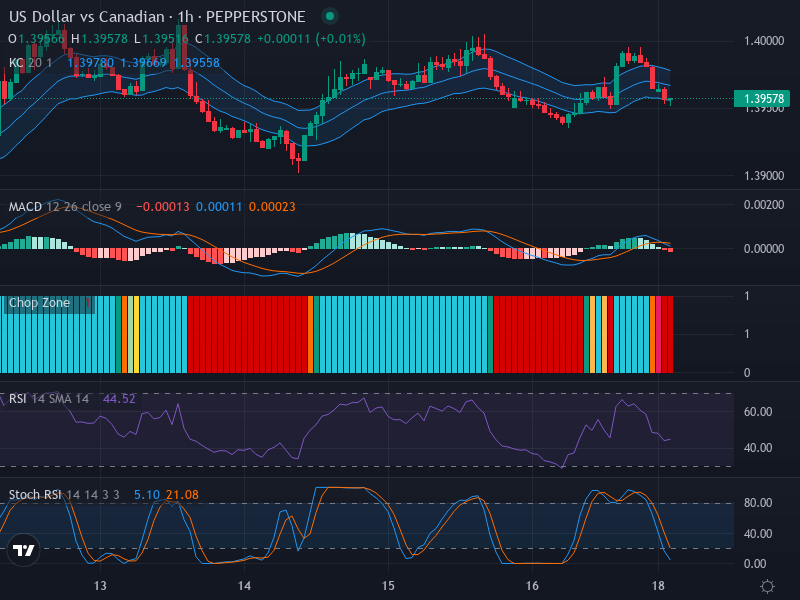
Examining the Relative Strength Index (RSI), currently at 44.55, the market appears to be in the neutral zone, albeit leaned towards oversold territory. This RSI positioning may suggest possibilities for either downwards continuation or a minor price bounce, mirroring the aforementioned uncertainty. There is a consistent narrative within the RSI that shows no considerable divergence with the price action.
The Keltner Channels provide relevant insights. The price is trading below the middle band of the EMA 20, affirming the bearish sentiment. Additionally, the moderate widening of the Keltner Channel reveals increased volatility, a condition that often precedes severe price movements.
Finally, the evaluation of the Stochastic RSI cues deeper into the bearish territory. With the K and D values standing at 12.10 and 23.93 respectively, both metrics are significantly in the oversold region, reinforcing the anticipation of either a bearish continuation or a bounce-back.
Conclusion and Trading Recommendations
Given the prevailing bearish trend, traders may consider selling opportunities, at least until some convincing bullish signals surface. However, caution is suggested due to the potential for price retracements and increased volatility. Critical resistance at 145.600 needs to be closely monitored, while continued movement in the oversold area could provide a potential buying opportunity in anticipation of a bounce-back.
Now, let’s analyze the trends across different time frames:
- In the 1-week time frame, the trend remains bearish, supported by consistent lower highs and lows. However, early signs of potential bullish corrections may start to emerge, prompting monitoring of key resistance levels.
- The 1-day time frame also indicates a bearish bias, with sellers currently in control; yet, the proximity to oversold conditions suggests a likelihood of some market correction in the coming days.
- For the 4-hour time frame, bearish momentum remains strong, but there are signs of exhaustion, possibly indicating a temporary pause or reversal.
Given these insights, potential entry points and expected profit zones may align as follows:
- Buy Entry Point: 145.250, Take Profit Point: 145.600, Stop Loss Point: 145.100.
- Sell Entry Point: 145.450, Take Profit Point: 145.000, Stop Loss Point: 145.600.
Overall, the analysis presents a more convincing case for a Sell scenario currently, given the clear bearish indicators across the time frames, but traders should remain alert for any signs of trend reversal.