
Bullish Momentum Emerges on the AUD/USD Chart: A Detailed Technical Overview – 02/04/2025
Tháng 4 1, 2025
Navigating California’s Strict Gun Laws: The Battle Against Ghost Guns and Background Check Developments
Tháng 4 2, 2025Market Overview:
The British Pound to US Dollar (GBP/USD) currency pair currently exhibits equivocal market behavior. With the relentless back and forth price movements, the market seems to have adopted a lateral or sideway direction. It is hovering within a narrow range, unable to establish a strong directional impulse. In uncertain times like these, traders eagerly anticipate clearer indicators to identify potential hotspots for price surges.
Technical Analysis:
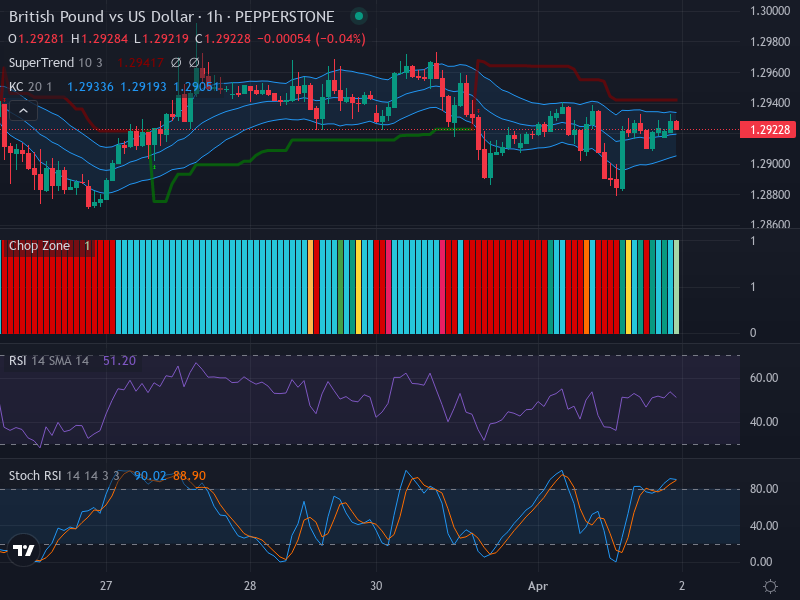
A relatively neutral narrative has emerged in the current GBP/USD markets, as the candlestick patterns on the display focus predominantly on small-bodied candles. Small-bodied candles often denote a sense of uncertainty or indecisiveness amongst forex traders. This pattern confirms that there is no substantial directional bias, and the market participants are presumably awaiting stronger signals before committing to any long-term positions.
In terms of critical price points, two opposing regions seem plausible for potential significant market movements, i.e., the 1.2960 and 1.2880 line, acting as resistance and support levels respectively. These levels could invoke considerable changes in price trajectories should the market dynamics engage at either end of the range.
The Relative Strength Index (RSI) currently stands at 51.20, further corroborating the sideways market sentiment. Centered in the neutral zone, the RSI fails to indicate any significant market momentum. At the same time, the absence of divergences between RSI values and price behavior suggests a cautious market cycle.
A conflicting narrative is offered by the Stochastic RSI. The K and D values—measured at 90.02 and 88.90, respectively—reside in the overbought range. The imminent crossover could exert downward pressure, leading to a possible short-term bearish loop.
From the Keltner Channels perspective, price fluctuations continue to oscillate around the middle band—another telltale sign of lateral bias. Alongside that, the channel shows slight expansion, hinting toward an increasingly volatile environment.
Conclusion and Trading Recommendations:
Under the current market overview, traders should remain nimble and vigilant. The market’s neutral sentiment, coupled with potential downward pressure emerging from the Stochastic RSI, points towards a scenario of either staying put or considering short-term sell positions.
Trading within the given range might potentially be profitable during this phase. Bulls could look for opportunities to buy at or near the support level (1.2880), while bears might seek short selling prospects near resistance at (1.2960). However, traders are advised to observe market signals carefully before entrusting their faith in a particular strategy, as currency markets can be unpredictable and swiftly change direction.
Time Frame Analysis and Entry Points:
- 1-Week Trend: Generally shows neutral with potential bearish implications due to the lack of strong momentum.
- 1-Day Trend: Indicates a sideways movement, indicating market indecision.
- 4-Hour Trend: Reflects slight bullish pressure but remains inconclusive for definitive direction.
From this analysis, potential entry points based on the 1-Hour Time Frame are as follows:
- Buy Entry Point: 1.2880, Take Profit Point: 1.2940, Stop Loss Point: 1.2860.
- Sell Entry Point: 1.2960, Take Profit Point: 1.2900, Stop Loss Point: 1.2980.
Overall, the scenario seems to lean slightly towards the Sell side due to the pressure indicated by the Stochastic RSI and the overall neutral sentiment of the market.


