Navigating Parental Rights in Colorado: The Impact of the Kelly Loving Act and Beyond
Tháng 5 15, 2025
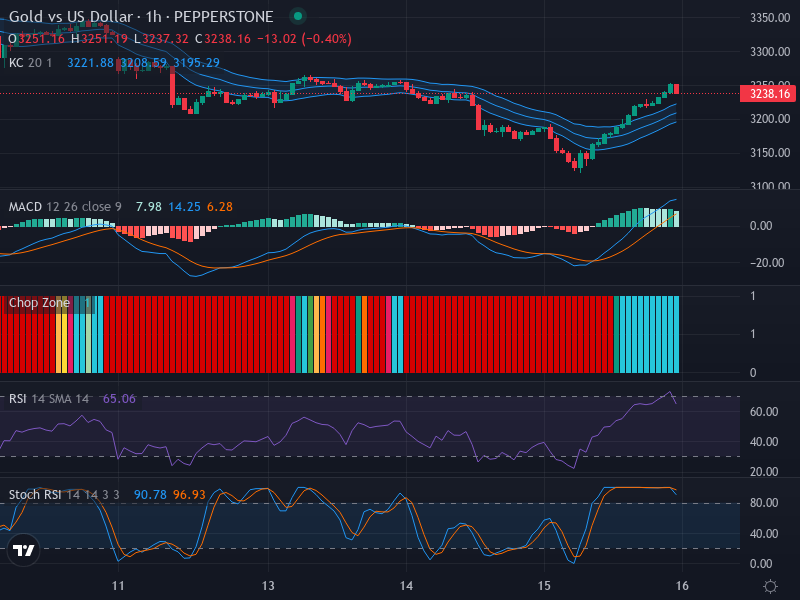
Forex Analysis: Bullish Forces Struggle as Gold vs USD Faces Potential Reversal – 16/05/2025
Tháng 5 15, 2025Market Overview:
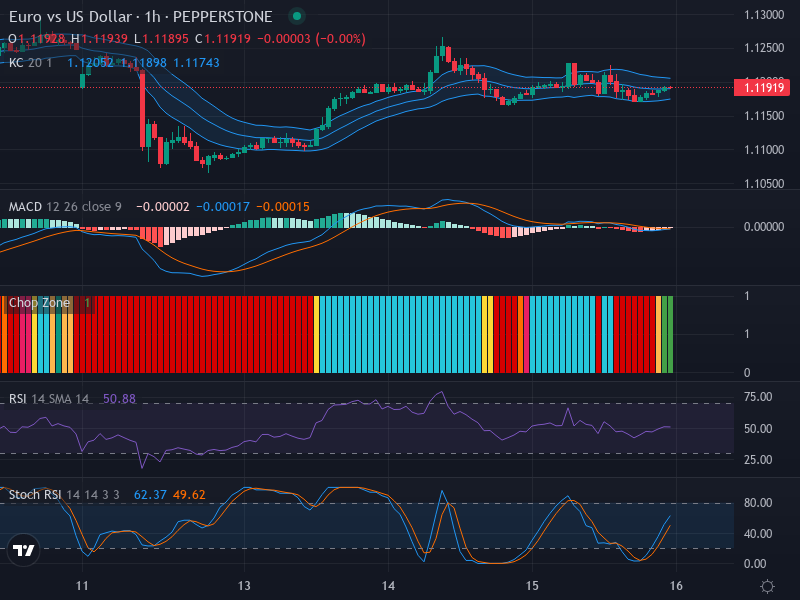
The Euro versus US Dollar (EUR/USD), one of the most traded currency pairs in the forex market, is currently seeing a phase of lateral movement, exhibiting no major signs of upward or downward trends. Prevailing at a value of 1.11919, it presently portrays a state of market equilibrium, with no significant bullish or bearish exposures.
Technical Analysis:
Utilising the power of various technical indicators such as the Relative Strength Index (RSI), Stochastic RSI, Moving Average Convergence Divergence (MACD), and price patterns, we can carefully examine the concise market state and develop potential market expectations.
The candlestick chart presents no notable bullish or bearish formation, indicating a continued state of market neutrality. However, traders should observe for possible breakout zones around the recent high at 1.1250 or the recent low of roughly 1.1150.
The RSI, a renowned tool for gauging momentum, is hovering at a neutral position of 50.88. The current absence of any clear divergence correlation between RSI values and the price level indicates a relatively indistinct potential for any remarkable price momentum.
Delving into the Stochastic RSI—a momentum oscillator that measures the level of a security’s close relative to the high-low range—it exhibits a K value of 62.37 and a D value of 49.62. These readings, which indicate a recent crossover, tend to imply a possible uptick in the bullish momentum if sustained.
The MACD, an excellent trend-following momentum indicator, portrays minute negative momentum, with the MACD line (-0.00002) marginally below the Signal Line (-0.00017). This signifies the lack of any substantial bullish or bearish crossovers, further reinforcing the market neutrality.
Conclusion and Trading Recommendations:
Given the mixed technical signals from various indicators, traders may opt to take a cautious stance. The market currently dwells in lateral movement, where both breakout and breakdown potentials seem plausible. Traders should carefully watch the corresponding breakout zones (1.1250 for bullish and 1.1150 for bearish) for potential strategic entries or exits.
In terms of short-term forecasting:
- 1-week Trend: The overall bearish momentum is weak, with notable resistance forming around the 1.1250 level.
- 1-day Trend: Neutral sentiment prevails, with sideways consolidation expected to continue.
- 4-hour Trend: A slight bullish inclination is noticeable, yet this may become significant based on price action around the 1.1250 level.
Potential entry points based on the above analysis could be formulated as follows:
- For a Buy scenario, consider an entry at 1.1200, aiming for a Take Profit at 1.1250 and setting a Stop Loss at 1.1175.
- For a Sell scenario, a suitable entry could be around 1.1150, targeting a Take Profit at 1.1100 with a Stop Loss at 1.1175.
Currently, the likelihood favors a Buy scenario given the slight bullish skew in the 4-hour analysis, but traders should remain vigilant and adapt to market movements.