Euro vs US Dollar: A Comprehensive Analysis of Current Market Conditions – 02/04/2025
Tháng 4 1, 2025
Bullish Momentum Emerges on the AUD/USD Chart: A Detailed Technical Overview – 02/04/2025
Tháng 4 1, 2025Market Overview
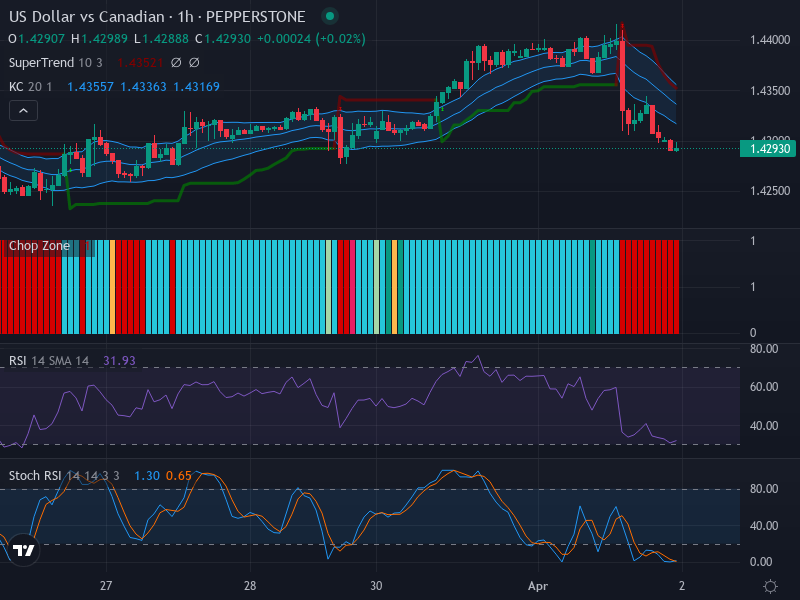
Amid the complicated forex landscape, the currency pair US Dollar (USD) vs Canadian Dollar (CAD) has attracted noticeable interest from traders and investors alike. The current trend showcases a bearish sentiment, with declining short-term market direction. This is substantiated by the preponderance of bearish candlesticks and the currency pair’s position below the renowned Keltner Channels. The key support zones are projected at around 1.4250.
Technical Analysis
The chart’s overall pattern for the currency pair USD/CAD demonstrates a consistent downward push, manifesting primarily in the considerable prevalence of bearish candlesticks. This bearish trend is emphasized by its position below the Keltner Channels, which may potentially signify persistent bearish pressure in the short term.
Moreover, as far as the precise support and resistance levels are concerned, we identify critical support zones around the price level of 1.4250. These zones could potentially experience a price retracement if the current downward momentum decelerates or comes to a halt.
Upon examining the Relative Strength Index (RSI) readings, we find that the market is gravitating towards the oversold territory, consequently aligning and reinforcing the bearish trendline with the RSI pegged at 31.93. At this moment, RSI divergence is negligible, cementing the continuity of the prevailing bearish momentum.
In the more nuanced readings of the Stochastic RSI, both its components K and D (clocking in at 1.30 and 0.65, respectively) are positioned in oversold territory. The K line’s trend crossing below the D line indicates the continuity of bearish momentum rather emphatically.
Meanwhile, the Keltner Channels further diagnose the currency pair, the price currently resides below the middle EMA 20 and expands downward. It suggests an increase in volatility and the acceleration of bearish momentum. The Chop Zone, though predominantly indicating a sideways movement before the breakout, now confirms the resumed bearish activity with its red bars.
Conclusion and Trading Recommendations
In the grand framework of a week, the USD/CAD pair’s technical analysis showcases an unmistakably bearish trend, backed by coherent indicators. Over a 1-day period, although the same bearish inclination is visible, there seems to be a slight lean towards oversold conditions.
While the current pattern elicits a bearish atmosphere, it would be prudent to keep a close eye on the potential upticks around the identified support zones. Considering the forecast, traders might consider capitalizing on the bearish trend by initiating short positions. However, potential oversold conditions might develop into a pitfall, making caution a valuable companion.
Trading Analysis
- 1-Week Trend: Strong bearish momentum is dominating with consistent support at 1.4250, indicating an established downward trend.
- 1-Day Trend: While bearish sentiment prevails, the market shows signs of approaching oversold levels, hinting at potential retracement opportunities.
- 4-Hour Trend: The prevailing bearish trend shows volatility; however, caution is advised as approach towards support zones may lead to minor recoveries.
Potential entry points based on this analysis could be as follows:
- Buy Entry Point: 1.4250, Take Profit Point: 1.4300, Stop Loss Point: 1.4230. This suggests a bounce from support with a small chance of retracement.
- Sell Entry Point: 1.4200, Take Profit Point: 1.4150, Stop Loss Point: 1.4220. This aligns with the continuation of the bearish trend as the market maintains downward pressure.
Given this analysis, a Sell scenario appears to be more likely than a Buy scenario in the current market conditions. Traders should remain vigilant and prepared to act depending on market movements.