Forex Market Insight: EUR/USD Analysis Amid Latent Sideways Trend – 15/05/2025
Tháng 5 14, 2025
Don’t Be a Panican: Challenge Government Shenanigans in Today’s Climate
Tháng 5 15, 2025Market Overview:
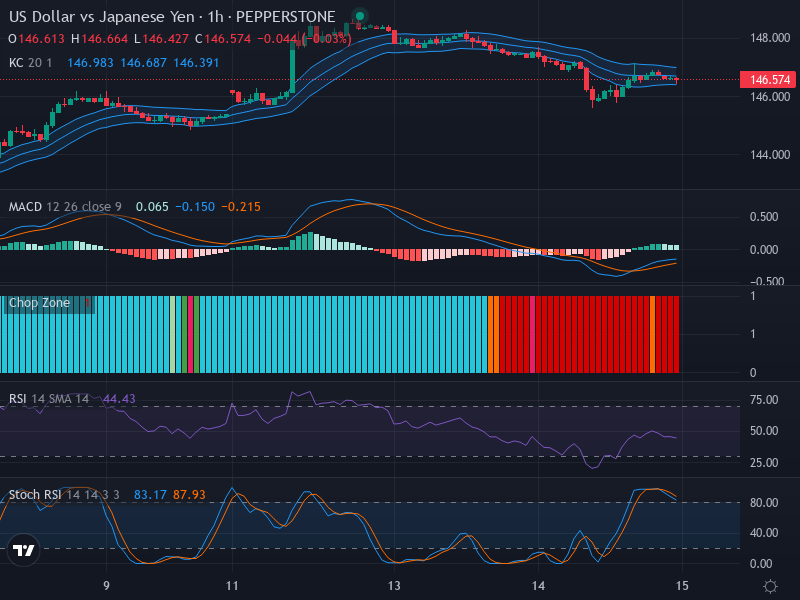
The Forex pair USD/JPY has experienced a phase of steady consolidation, as illustrated by small fluctuations in its price. As of now, the pair trades at 146.574. Both technical analysis and indicators point towards a neutral trend, however, certain potentialities for an upward or downward movement can be identified based on the scrutiny of various indicators.
Technical Analysis:
Currently, the USD/JPY chart exhibits small candlesticks – a phenomenon typically indicative of a lateral, or sideways, market direction. This suggests that investors may be expressing a mix of indecisiveness and equality regarding purchasing power and selling pressure. Thus, the market appears to be in a state of equilibrium, where no discernible bullish or bearish patterns seem to be forming.
Detailed observations hint at likely retracement zones around the 146.700 mark. This value corresponds with a previously observed resistance level, implying that buyers might struggle to push the price beyond this point, and hence, it could become a pivotal factor in future price movement trajectories.
The Relative Strength Index (RSI) stands at 44.43. This value communicates a neutral to slightly oversold condition for the asset. The declining RSI line corroborates the recent price drop, and without any evident divergence, it suggests no substantial contradicting movement alerting caution.
The Stochastic RSI gives us additional insights. With a K Line at 83.17 and a D Line at 87.93, it appears that the asset may be oversold. These figures hint at the possibility of an imminent reversal if the lines experience a crossover.
The Moving Average Convergence Divergence (MACD) also provides potentially buoyant news for the USD/JPY pair. With the MACD Line (0.065) hovering above the Signal Line (-0.150), it reveals an underlying bullish leaning, although this is mitigated by the close proximity of the two lines. The histogram’s ascending pattern further implies an increase in bullish momentum, which could potentially translate into upward price movements.
Examining the Keltner Channels and Chop Zone Indicators, the close proximity of the price to the lower band of the Keltner Channels could signify a potential upward momentum, provided market volatility intensifies. Consistent with the overall neutral market situation, the Chop Zone is currently displaying blue bars.
Conclusion and Trading Recommendations:
In light of the observed technical parameters, it appears that the market is in a lateral or sideways trend with a slight hint of bullish sentiment indicated by MACD and Keltner Channel observations. That said, the Stochastic RSI suggests the asset is oversold and might be due for a turnaround should crossovers occur. Thus, it might be wise for traders to wait for further signs of definitive trend direction before placing any trades.
Trend Analysis and Entry Points
Analyzing the 1-week, 1-day, and 4-hour time frames reveals the following trends:
- The 1-week time frame indicates a bearish trend with price struggling to break above established resistance levels, suggesting continued selling pressure.
- On the 1-day time frame, price movement remains predominantly sideways, aligning with the neutral stance yet hinting at potential bullish reversals with appropriate confirmation.
- The 4-hour time frame shows minor bullish momentum emerging from oversold conditions but remains cautious due to lack of clarity in momentum signals.
Potential entry points based on the analysis are:
- Buy entry point at 146.600, Take profit point at 147.000, Stop loss point at 146.300.
- Sell entry point at 146.400, Take profit point at 145.800, Stop loss point at 146.700.
Considering the overall analysis, it seems more favorable for buyers to emerge, thus a Buy scenario appears more likely to occur, suggesting traders should closely monitor for bullish confirmations.