An In-Depth Analysis of the Stagnating USD/CHF Forex Market – 02/04/2025
Tháng 4 1, 2025
Breakthrough in the NZD/USD Pair: Comprehensive Technical Analysis and Trading Recommendations – 02/04/2025
Tháng 4 1, 2025Market Overview:
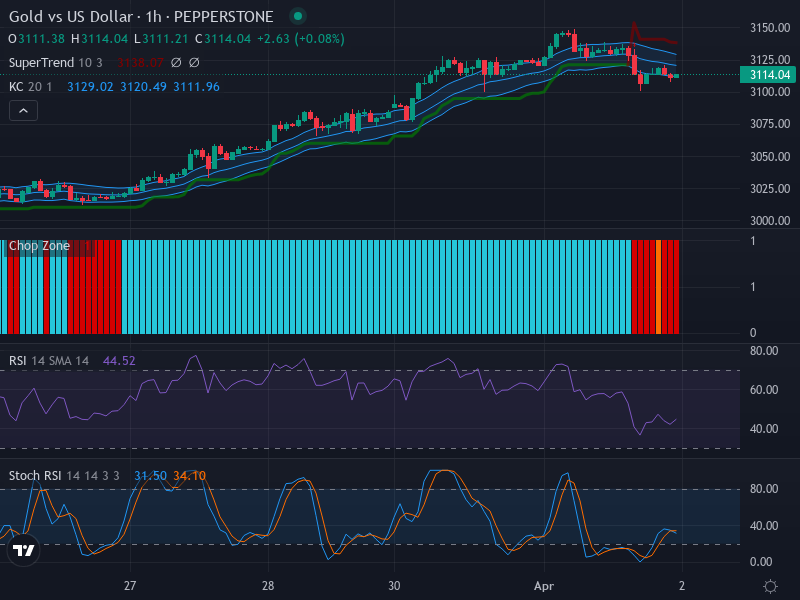
The Gold vs US Dollar (XAU/USD) currency pair is currently exhibiting a lateral market direction with a slight bearish bias. This comes after a previous period of slightly bullish activity. Increased volatility is also noticeable at the moment. The market appears to be in a neutral state, perhaps edging slightly into oversold territory, with both the long and short-term trends indicating a possible continuation of this bearish inclination.
Technical Analysis:
Analyzing the candlestick patterns of the XAU/USD, there is a visible tilt towards sideways movement with intermittent bearish pressure. The latest bearish candlestick positioned itself outside of the Keltner Channel bands, pointing to an increase in selling pressure. Market direction remains lateral, with resistance expected around the 3125 mark and support speculated to surface near 3100.
A look at the Relative Strength Index (RSI) substantiates the inference obtained from the candlestick pattern. The RSI stands a little below the mid-line at 44.52, indicating a neutral to slightly oversold market. Still, the lack of a significant divergence between price trends and the RSI values signifies alignment with the market’s neutrality.
The Keltner Channel indicator further elucidates the market scenario. The previously slight bullish trend has gone horizontal, with the widening channel revealing an upsurge in market volatility. The Chop Zone indicator also hints at the possibility of a future trend shift, as its bars have pivoted from blue to red, forecasting growing disorder.
The Stochastic RSI (Stoch RSI) analysis provides a numerical take on the market situation. The Stoch RSI K Line is at 31.50, and the D Line at 34.10. The position of the K line below the D line signifies bearish momentum, and a value below 50 potentially heralds the continuation of this momentum until a reversal occurs.
Conclusion and Trading Recommendations:
Considering the current market indicators, it would seem that the Gold vs US Dollar (XAU/USD) pair is entrenched in a neutral to slightly bearish market scenario. As such, traders could consider waiting for clear signals of a reversal before entering long positions.
For aggressive traders, short positions might be considered but bearing in mind that the market isn’t at extremely oversold levels and that a sudden reversal is a possibility. No matter the trading strategy used, investors should always ensure that stop losses are properly set to mitigate any potential risks.
Detailed Trend Analysis:
In analyzing the 1-week, 1-day, and 4-hour time frames, the following trends have emerged:
- On the 1-week timeframe, the market indicates a steady decline with resistance holding firm at higher levels, suggesting a continuation of bearish pressure.
- In the 1-day timeframe, technical indicators point towards weakness, still holding above support but showing signs of potential breakdown.
- The 4-hour timeframe reveals an overall stagnant behavior with sporadic bearish movements, reinforcing the overall bearish sentiment.
Potential Entry Points and Analysis:
Based on this comprehensive analysis, potential entry points are as follows:
- Buy Entry Point: 3115, Take Profit Point: 3130, Stop Loss Point: 3100.
- Sell Entry Point: 3100, Take Profit Point: 3085, Stop Loss Point: 3110.
In conclusion, the market leans towards a more likely Sell scenario, given the bearish indicators and upward resistance levels. However, caution is advised as the potential for a reversal remains present.