
USDCAD Technical Analysis: Key Levels and Market Insights for May 2025
Tháng 5 14, 2025
NZDUSD Market Analysis: Bearish Trends Signal Caution for Forex Traders
Tháng 5 14, 2025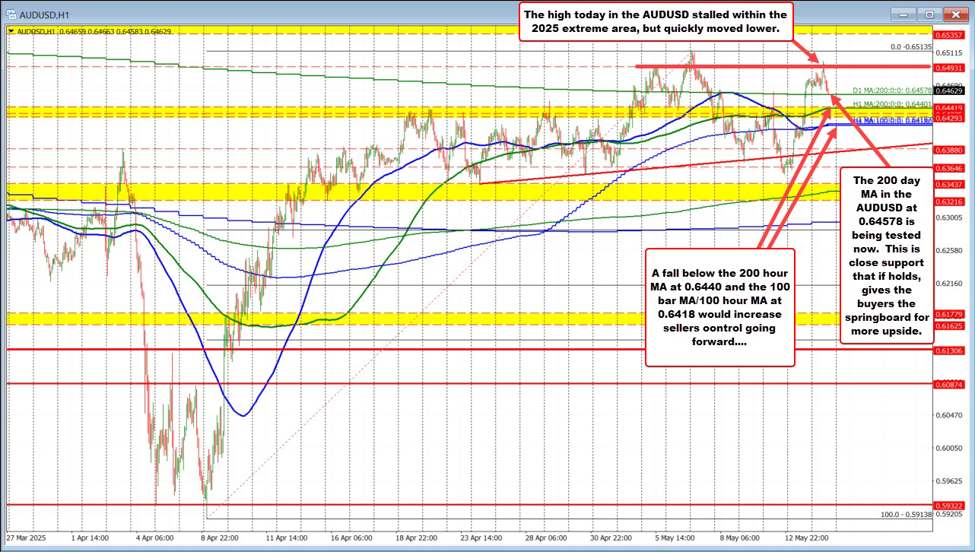
AUD/USD Technical Analysis Overview – Recent Findings and Insights
Current Technical Landscape
In the evolving landscape of the AUD/USD currency pair, recent technical developments offer critical insights for traders and investors. The most notable signal is the steadfast defense of the 200-day moving average (MA), which has emerged as a crucial long-term support level. This strong defense indicates an underlying resilience among buyers, providing a solid foundation despite a slight loss of upward momentum in the recent trading sessions.
The pair notably surged above the 0.6400 mark, buoyed by softer inflation data emanating from the United States. This surge is not only significant for its immediate impact but also for the bullish technical patterns that have developed, including an ascending channel, a mini “golden cross”—indicating a potential upcoming bullish crossover of the 50 and 100-day Exponential Moving Averages (EMAs)—as well as an inverse head and shoulders pattern. This latter formation is widely regarded among traders as a reversal indicator, further underscoring the potential for continued upward movement.
Adding to this bullish narrative, AUD/USD has surpassed the 50% Fibonacci retracement level, now eyeing the 61.8% retracement point at 0.6550, a level that traders are keenly watching.
Price Action and Momentum Analysis
The recent performance of AUD/USD reflects a breakout above the 0.6394–0.6444 range, with the current focus shifting toward the 0.6640/95 zone. While this upward movement signals potential bullish undertones, it’s important to note that short-term momentum appears to be waning. Should the pair fall below the 0.6444 threshold, traders may experience a potential pullback or consolidation phase, suggesting a temporary halt to its bullish momentum.
In an alternative scenario, a dip below 0.6444 could prompt a retest of the 0.6394 level, further indicating that bullish energy may be curtailed for the time being.
Key Resistance and Support Levels
Crucial to understanding the market’s trajectory are the key resistance and support levels. The 0.6513 mark serves as significant intraday resistance. A decisive break above this level would likely confirm the conclusion of the current one-hour downtrend. Meanwhile, 0.6444 holds short-term importance for maintaining a bullish bias, with 0.6394 being pivotal for the sustainability of the ongoing uptrend. The robust defense of the 200-day MA continues to provide long-term support.
Momentum Indicators and Upcoming Events
Momentum indicators reveal a mixed but generally bullish picture. The Marlin Oscillator shows bullish tendencies but may test the lower boundary of the bearish territory if momentum falters. The 20-day Simple Moving Average (SMA) has signaled a buy, whereas the 50 and 100-day SMAs reflect a more neutral to bearish perspective in the short term, albeit with signs of a bullish crossover potentially on the horizon. The Relative Strength Index (RSI) also supports a buy signal, reflecting positive intraday momentum.
Looking ahead, significant market events could further influence the AUD/USD direction. Notably, the release of Australia’s job data is expected soon, with the unemployment rate forecasted at 4.1% and an addition of 20,000 jobs anticipated. Concurrently, data from the U.S. including retail sales, the Philadelphia Fed manufacturing index, and Producer Price Index (PPI) inflation are scheduled for release, which could all contribute to volatility in the currency markets. Traders should keep an eye on the EUR/USD market as well, where similar bullish patterns are emerging, as discussed in this analysis: Euro vs US Dollar Forex Analysis – Identifying the Bullish Momentum Amid Consolidation.
Conclusion
In summary, the AUD/USD currency pair showcases a compelling technical landscape characterized by significant bullish patterns and a robust defense at key support levels. While current momentum suggests further potential for upside movement, traders must remain cautious of potential pullback scenarios if critical support levels are breached. The impending Australian jobs report and other economic data releases present vital catalysts for market movement as all eyes remain on the targets of 0.6550 and beyond. Additionally, maintaining awareness of the GBP/USD market’s neutral trading range can help inform strategic decisions, as noted in the following post: A Neutral Tide in the GBP/USD – Current Key Technical Notes and Strategies.