Potential Market Flip on the Horizon: An Analysis of the USD/JPY Exchange Rate – 14/05/2025
Tháng 5 13, 2025
In-Depth Study on the Rising Trend of GBP/USD – A Cautious Bullish Overview – 14/05/2025
Tháng 5 13, 2025Market Overview
The intriguing dynamics between gold and the US Dollar have retained a place in the minds of forex traders due to the commodities’ intrinsic value and the Greenback’s chief reserve currency position. As of the latest assessment, the pair exhibits a sideways movement, hinting at the market’s current impasse. The market displays an interesting blend of anticipation and careful restraint, with both the bulls and bears refraining from firm commitments.
Technical Analysis
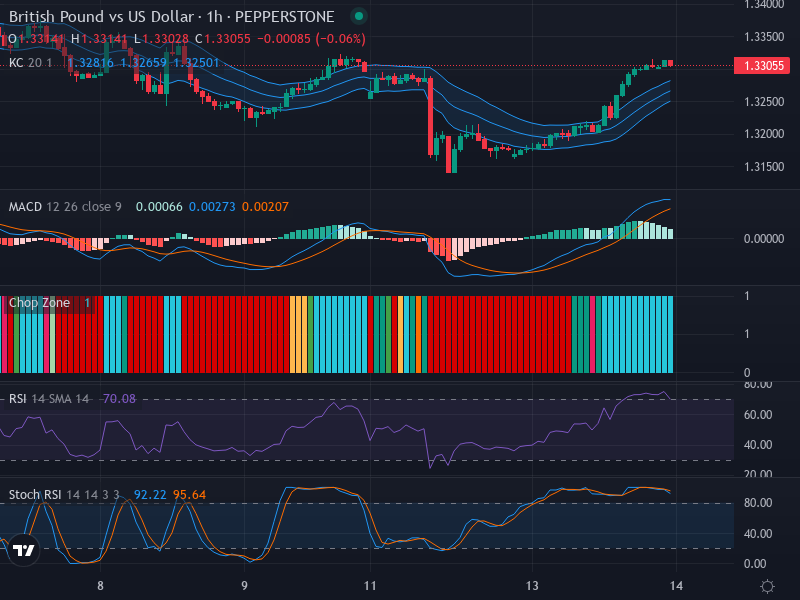
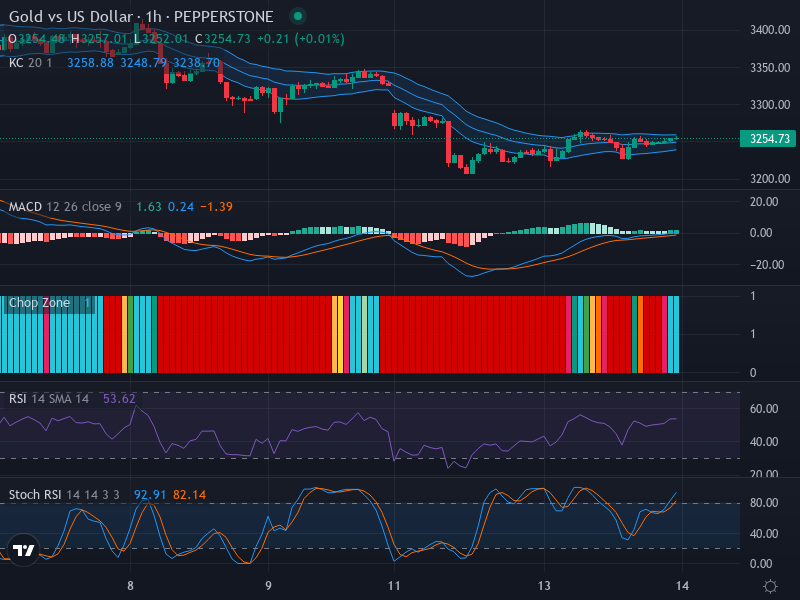
Positioning the lens onto the 1-hour chart, it is evident that the price action is more or less moving sideways, as marked by the prevalence of small-bodied candles suggesting market indecision. The market has yet to portray a convincing bullish or bearish engulfing pattern, making it difficult for investors to identify the trend.
Upon examining the Relative Strength Index (RSI), we notice that the value stays in the neutral territory, reading at 53.62. This further affirms the lack of directional bias in the market. Meanwhile, the absence of visible divergence between the RSI and price movement implies that there is harmony between price behavior and momentum—again an indication of the neutral sentiment in the market.
Switching to the Keltner Channels and Chop Zone, it’s evident that the primary trend aligns with the sideways scenario. The price hovers near the middle band of the Keltner Channel, reinforcing the neutral trend. Concurrently, the red bars lighting up in the Chop Zone suggest a market in a consolidation phase, mounting a watchful landscape for the traders.
Contrarily, the Stochastic RSI (Stoch RSI) draws a somewhat different picture. With the K Line hovering at 92.91 and the D Line at 82.14, it suggests that the market is in an overbought condition. This warning of potential overvaluation, combined with a recent bullish crossover, could signal a forthcoming downward correction. This is something traders should vigilantly observe to untangle the otherwise neutral market saturations.
Lastly, venturing into MACD analysis, we are currently witnessing the MACD Line at 1.63, lingering just above the Signal Line at 0. This window of a very slight bullish bias could potentially be indicative of a minor upward swing, but the lack of a significant difference between the two lines keeps the market oscillating in its neutral state.
Conclusion and Trading Recommendations
The existing technical analysis portrays a market lacking a decisive directional bias, with a slight tilt towards a potential downward correction as suggested by Stoch RSI. If a breakout happens, we anticipate the price could possibly ascend towards the 3,300 mark or fall back to the support at 3,200.
In terms of shorter time frames, here are the key insights:
- 1-week time frame: The trend is neutral with a potential for reversal, awaiting confirmation from upcoming economic indicators.
- 1-day time frame: Recent movements show consolidation, with signs leaning towards a possible downward correction.
- 4-hour time frame: There’s a slight bullish bias, though the overall trend remains sideways with lack of strong momentum.
For traders looking for entry points, based on the above analysis of the indicators:
- Buy entry point: 3,250, with a take profit point at 3,300 and a stop loss point at 3,220 for risk management.
- Sell entry point: 3,200, with a take profit point at 3,150 and a stop loss point at 3,220 to limit losses.
Considering the current indicators, the more likely scenario appears to be a Sell given the overbought conditions indicated by Stoch RSI and the existing resistance near 3,250. Therefore, traders may wish to prioritize looking for sell opportunities while remaining vigilant for sudden trend changes.