eToro’s IPO: What Investors Need to Know Before the Big Day
Tháng 5 13, 2025
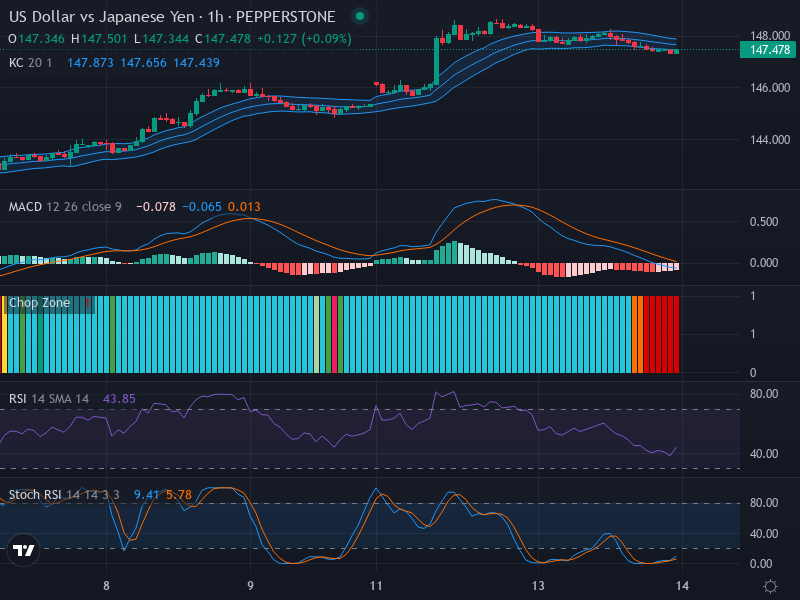
Potential Market Flip on the Horizon: An Analysis of the USD/JPY Exchange Rate – 14/05/2025
Tháng 5 13, 2025Market Overview
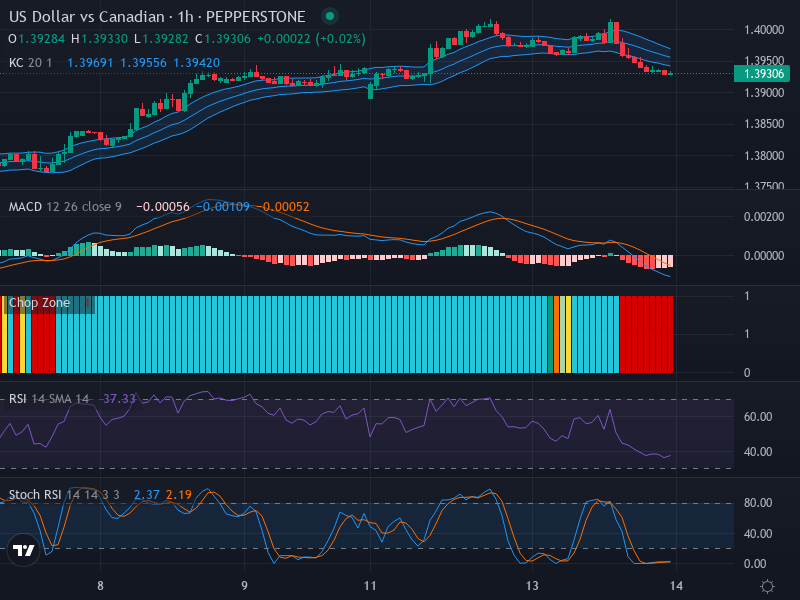
At present, the USD/CAD Forex pair appears to be exhibiting signs of a potential price reversal. Following a period of sideways movement, the US Dollar vs Canadian Dollar (USD/CAD) has embarked on a mild downtrend, with speculators now looking towards potential retracement zones at the 1.39000 and 1.39500 levels.
Technical Analysis
The recent behavior of the currency pair is best characterized by the absence of any substantial bullish or bearish candlestick patterns. This void in pattern dynamics might put traders in governance by the underlying indicators.
One of the noteworthy indicators here is the Relative Strength Index (RSI), currently sitting at 37.33. This RSI value is rapidly closing in on the oversold territory, which usually signals an impending price correction or possible reversal. Preliminary corroborating evidence for this theory comes from the confirmed alignment of the RSI trend with the mild downward movement of the pair.
However, further compelling evidence for a price reversal or upward correction surfaces when examining the Stochastic RSI, whose K and D lines are posted at 2.37 and 2.19 respectively. Both lines are moving in the oversold territory, with hints of an intersection that may imply an upcoming rise.
In resonance with these findings, the Moving Average Convergence Divergence (MACD) also indicates a bearish crossover. With the MACD line situated under the signal line and the Histogram Momentum displaying slightly diminishing negative bars, the possible weakening of the downward momentum becomes more concrete.
Throwing another analytical tool into the mix, the Keltner Channels suggests that the currency pair is placed at the lower band. This placement is usually suggestive of an impending bounce, provided it is vouched for by the other indicators at work.
Conclusion and Trading Recommendations
Considering the data from each of the technical indicators, there is a compelling case for an upcoming rise in price or a reversal in trend for the USD/CAD. The confluence of these indicators may be signaling an opportune moment for traders to open a long position.
However, it is critical to punctuate this analysis with a cautionary note: trading decisions should be corroborated by additional analysis or further news releases that might affect the currency pair. This is also an opportunity to keep a keen eye on the swing-highs monitoring, as they could serve as potential resistance levels.
Risk Disclaimer
The information and analysis provided here are for informational purposes only. This analysis does not account for individual’s personal financial situation or investment objectives. Therefore, this should not be considered as a personalized financial advice or a trading recommendation. Trading foreign exchange on margin carries a high level of risk and may not be suitable for all investors. Past performance is not indicative of future results.
Trend Analysis and Trading Points
In analyzing the 1-week, 1-day, and 4-hour time frames for the USD/CAD, the trends can be summarized as follows:
- The 1-week trend indicates a general bearish tendency with signs of stabilization.
- The 1-day trend shows short-term fluctuations but maintains a neutral stance with potential for upward movement.
- The 4-hour trend exhibits a minor downward trend but hints at a reversal due to oversold conditions.
Based on these analyses, potential entry points in the 1-hour time frame could be identified for traders. For a Buy scenario, an entry point could be established at 1.39200, with a Take Profit level set at 1.39800 and a Stop Loss positioned at 1.39000. Conversely, for a Sell scenario, an entry at 1.39450, a Take Profit target of 1.39050, and a Stop Loss at 1.39650 could be considered.
Given the confluence of supportive indicators suggesting a price increase, a Buy scenario appears more likely to emerge in the near term.